 Back
Chapter 20: Phylogeny – Understanding Evolutionary Relationships
Study Guide - Smart Notes
 Tailored notes based on your materials, expanded with key definitions, examples, and context.
Phylogeny: The Evolutionary History of Life
Introduction to Phylogeny and Systematics
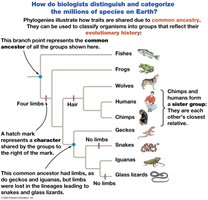
Phylogeny is the evolutionary history of a species or group of related species. Systematics is the scientific discipline focused on classifying organisms and determining their evolutionary relationships. Phylogenies are essential for understanding how traits are shared due to common ancestry and for organizing the diversity of life into meaningful groups.
Phylogeny: The evolutionary history and relationships among species or groups.
Systematics: The study of biological diversity in an evolutionary context, including taxonomy and phylogenetics.
Application: Phylogenies help biologists classify organisms in a way that reflects their evolutionary history.
Taxonomy: Naming and Classifying Organisms
Binomial Nomenclature
To avoid confusion caused by common names, biologists use a two-part scientific naming system called binomial nomenclature. Each species is assigned a unique Latinized name consisting of the genus and species.
Genus: The first part of the name, capitalized (e.g., Homo).
Species: The second part, unique within the genus (e.g., sapiens).
Formatting: The full binomial is italicized (e.g., Homo sapiens).
Hierarchical Classification
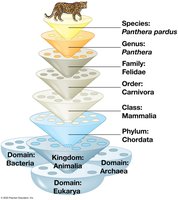
Carolus Linnaeus developed a hierarchical system for classifying organisms. This system organizes species into increasingly broad categories, from species up to domain.
Hierarchy: Species → Genus → Family → Order → Class → Phylum → Kingdom → Domain
Taxon: Any named group at any level of the hierarchy.
Note: Higher categories may not be directly comparable between different groups.
Linking Classification and Phylogeny
Phylogenetic Trees
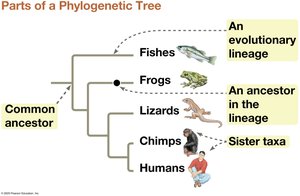
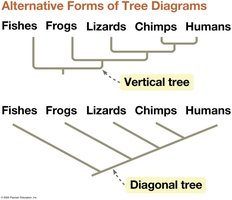
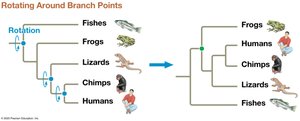
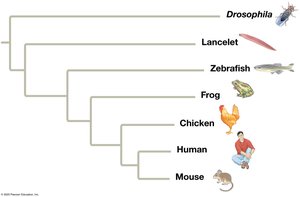
Phylogenetic trees are branching diagrams that represent hypotheses about evolutionary relationships. Each branch point (node) represents the divergence of two lineages from a common ancestor.
Sister taxa: Groups that share an immediate common ancestor.
Rooted tree: Includes a branch representing the most recent common ancestor of all taxa in the tree.
Basal taxon: A lineage that diverges early and is less closely related to other taxa.
Polytomy: A branch point with more than two descendant groups, indicating uncertainty.
Cladistics and Group Types
Cladistics: Organizing by Common Descent
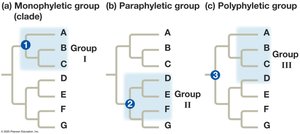
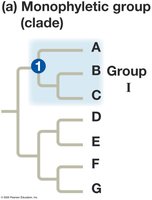
Cladistics is a method of systematics that groups organisms into clades based on common ancestry. Clades are monophyletic groups, meaning they include an ancestor and all its descendants.
Monophyletic group (clade): Includes an ancestor and all descendants.
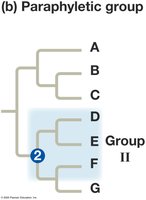
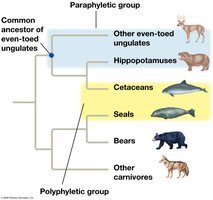
Paraphyletic group: Includes an ancestor and some, but not all, descendants.
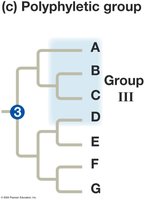
Polyphyletic group: Includes distantly related species but not their most recent common ancestor.
Shared Characters in Phylogenetics
Shared Ancestral vs. Shared Derived Characters
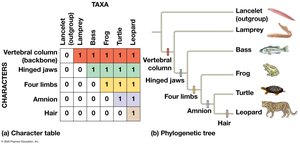
Characters used in phylogenetic analysis can be ancestral (shared with ancestors) or derived (unique to a clade). The same character may be ancestral in one context and derived in another.
Shared ancestral character: Originated in an ancestor of the group.
Shared derived character: An evolutionary novelty unique to a clade.
Loss of feature: The loss of a trait (e.g., limbs in snakes) can also be a shared derived character.
Mapping Characters on a Phylogeny
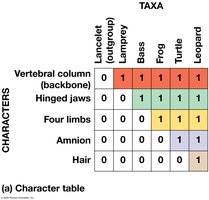
Mapping traits onto a phylogenetic tree helps visualize which characters are unique to certain clades. An outgroup is used for comparison to determine which traits are ancestral.
Ingroup: The group of species being studied.
Outgroup: A closely related group not part of the ingroup, used for comparison.
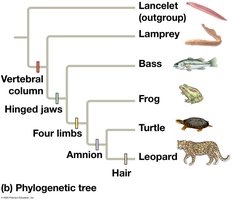
Phylogenetic Trees as Hypotheses
Testing and Revising Phylogenies
Phylogenetic trees are hypotheses that are tested and revised as new data become available. Predictions can be made based on these trees, such as inferring ancestral traits using phylogenetic bracketing.
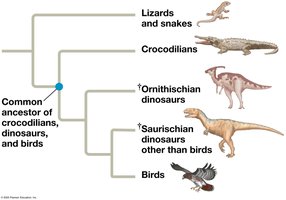
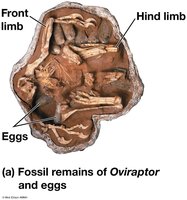
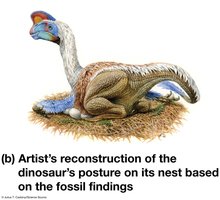
Phylogenetic bracketing: Predicts that features shared by two closely related taxa are present in their common ancestor and all descendants.
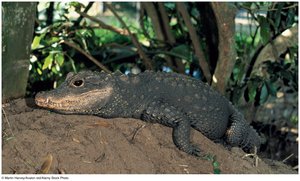
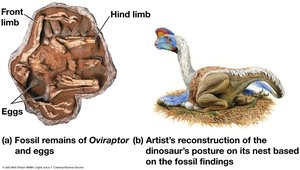
Example: Birds and crocodiles share traits such as four-chambered hearts and nest-building, suggesting these traits were present in their common ancestor.
Inferring Phylogenies: Morphological and Molecular Data
Homology vs. Analogy
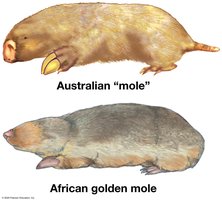
Homologies are similarities due to shared ancestry, while analogies are similarities due to convergent evolution. Only homologies are useful for inferring phylogeny.
Homology: Similarity due to common ancestry (e.g., vertebrate forelimbs).
Analogy: Similarity due to convergent evolution (e.g., wings of bats and insects).
Distinguishing: Genetic and fossil evidence, as well as complexity of structures, help distinguish homology from analogy.
Evaluating Molecular Homologies
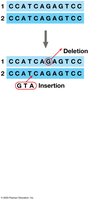
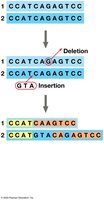
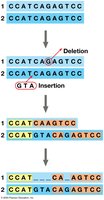
Molecular homologies are assessed by comparing DNA or protein sequences. Insertions or deletions can complicate alignments, and statistical tools are used to distinguish true homologies from coincidental matches.
Gene sequence similarity: Indicates likely homology.
Alignment: Computer programs align sequences to identify similarities and differences.

Phylogenetic Trees: Branch Lengths and Parsimony
Branch Lengths
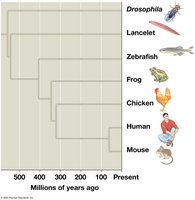
In some phylogenetic trees, branch lengths can represent the number of genetic changes or the passage of time, often calibrated with fossil data.
Genetic change: Longer branches indicate more genetic changes.
Chronological time: Fossil data can be used to estimate timing of divergences.
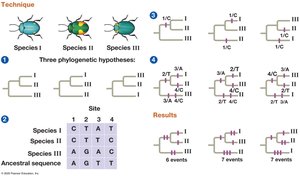
Maximum Parsimony
The principle of maximum parsimony states that the simplest explanation, requiring the fewest evolutionary changes, is preferred. Computer programs are used to find the most parsimonious tree.
Application: Used to narrow down possible phylogenetic trees in large datasets.
Molecular Clocks and Evolutionary Time
Molecular Clocks
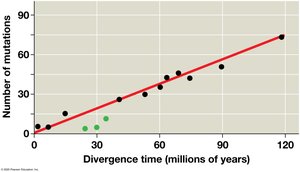
A molecular clock uses the rate of genetic mutations to estimate the timing of evolutionary events. The number of nucleotide substitutions is assumed to be proportional to the time since two species diverged.
Calibration: Molecular clocks are calibrated using fossil data.
Limitations: Not all genes evolve at the same rate; some genes are more clocklike than others.
Applications and Limitations
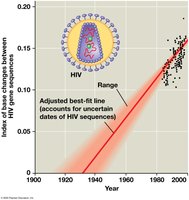
Molecular clocks have been used to date the origin of diseases such as HIV. However, irregularities in mutation rates and natural selection can affect accuracy.
Example: The origin of HIV-1 M was dated to around 1910–1930 using molecular clock analysis.
The Tree of Life: Domains and Horizontal Gene Transfer
From Two Kingdoms to Three Domains
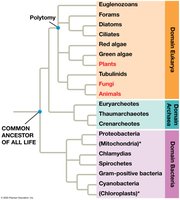
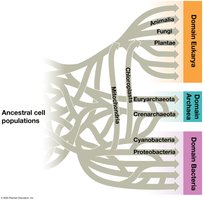
Modern classification recognizes three domains: Bacteria, Archaea, and Eukarya. This system is based on molecular data and reflects deep evolutionary relationships.
Bacteria: Most known prokaryotes.
Archaea: Diverse prokaryotes in various environments.
Eukarya: All organisms with true nuclei, including plants, fungi, and animals.
Horizontal Gene Transfer
Horizontal gene transfer (HGT) is the movement of genes between different species, which complicates the reconstruction of evolutionary history. HGT was likely common in early life and is a major factor in prokaryotic evolution.
Mechanisms: Exchange of plasmids, viral infection, fusion of organisms.
Impact: The early history of life may be better represented as a network rather than a simple tree.
Summary Table: Types of Groups in Phylogenetics
Group Type | Definition | Example |
|---|---|---|
Monophyletic | Ancestor and all descendants | All mammals |
Paraphyletic | Ancestor and some descendants | Reptiles (excluding birds) |
Polyphyletic | Distantly related species, not including most recent common ancestor | Marine mammals (whales, seals) |
Additional info: This summary integrates key concepts from Chapter 20 of "Campbell Biology in Focus," focusing on phylogeny, systematics, and the classification of life. It is designed for college-level General Biology students preparing for exams.
