 Back
Community Ecology: Structure, Interactions, and Dynamics
Study Guide - Smart Notes
 Tailored notes based on your materials, expanded with key definitions, examples, and context.
Community Ecology
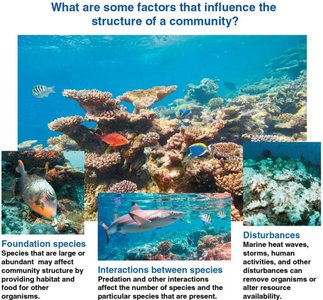
Introduction to Community Ecology
Community ecology examines the interactions between species living in the same area and how these interactions shape the structure and dynamics of biological communities. The structure of a community is influenced by the number, composition, and relative abundance of species present.
Community: A group of populations of different species living in close enough proximity to interact.
Community structure is determined by both biotic (living) and abiotic (non-living) factors.
Survivorship Curves and Life Tables
Understanding Survivorship Curves
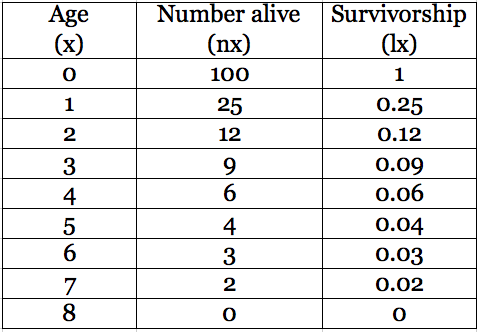
Survivorship curves graphically represent the number of individuals surviving at each age for a given species or group. Life tables provide quantitative data for constructing these curves.
Type I: High survivorship until old age (e.g., humans).
Type II: Constant survivorship throughout life (e.g., some birds).
Type III: Low survivorship early in life, with few individuals reaching adulthood (e.g., many fish, plants).
Age (x) | Number alive (nx) | Survivorship (lx) |
|---|---|---|
0 | 100 | 1 |
1 | 25 | 0.25 |
2 | 12 | 0.12 |
3 | 9 | 0.09 |
4 | 6 | 0.06 |
5 | 4 | 0.04 |
6 | 3 | 0.03 |
7 | 2 | 0.02 |
8 | 0 | 0 |
Example: The table above shows a rapid decline in survivorship early in life, characteristic of a Type III curve, often associated with species that produce many offspring but provide little parental care.
Population Growth Models
Exponential Growth Model
The exponential growth model describes how populations grow under ideal conditions, with no limiting factors.
Equation:
N: Population size
r: Intrinsic rate of increase (per capita growth rate)
Populations with higher r values grow faster and produce more offspring per generation.
Example: Comparing two populations, the one with the higher r value will grow more rapidly, while the one with the lower r value grows slower and produces fewer offspring per generation.
Species Interactions in Communities
Types of Interspecific Interactions
Species in a community interact in various ways, which can be classified by their effects on the interacting species:
Competition (-/-): Both species are harmed by the interaction.
Exploitation (+/-): One species benefits, the other is harmed (includes predation, herbivory, and parasitism).
Mutualism (+/+): Both species benefit.
Commensalism (+/0): One species benefits, the other is unaffected.
Competitive Interactions and Niche Concepts
Competition occurs when species vie for the same limited resources, affecting their survival and reproduction.
Competitive Exclusion Principle: Two species competing for the same limiting resources cannot coexist indefinitely.
Fundamental Niche: The full range of environmental conditions a species can potentially occupy.
Realized Niche: The actual conditions occupied due to competition and other biotic factors.
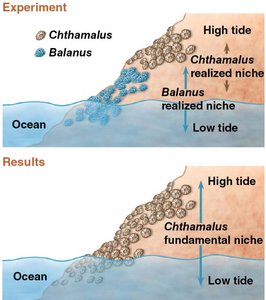
Example: In the intertidal zone, Chthamalus barnacles occupy a smaller realized niche due to competition with Balanus.
Character Displacement
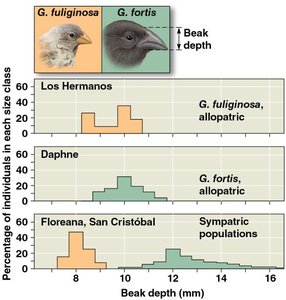
Character displacement is the tendency for characteristics to diverge more in sympatric (overlapping) populations than in allopatric (separate) populations due to competition.
Sympatric species often evolve differences that reduce competition.
Exploitative Interactions: Parasitism, Predation, and Herbivory
Parasitism: Parasite lives on or in a host, harming it. Can involve complex life cycles and behavioral manipulation of hosts.
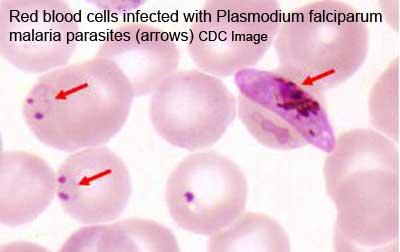
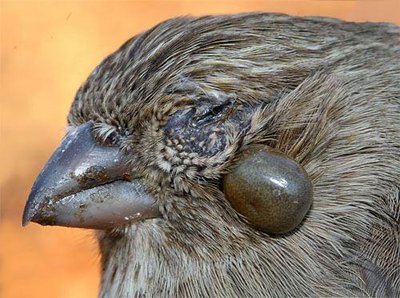
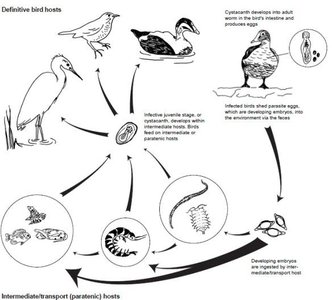
Predation: Predator kills and eats prey. Predators have adaptations for hunting; prey have defenses.
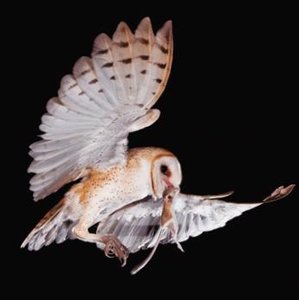
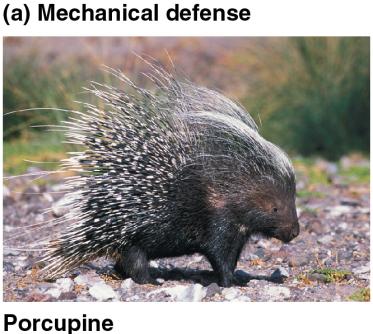
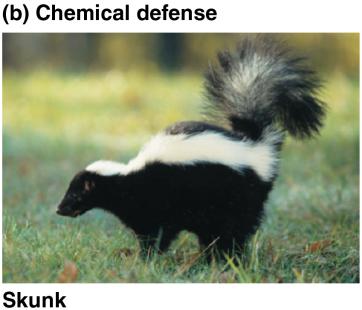
Prey Defenses: Behavioral (hiding, fleeing), morphological (spines), physiological (toxins).
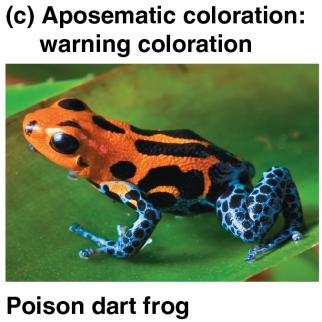
Aposematic Coloration: Bright warning colors in toxic species.
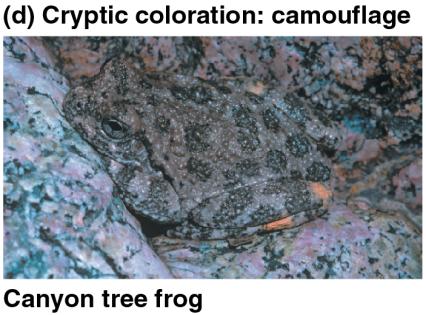
Cryptic Coloration: Camouflage to avoid detection.
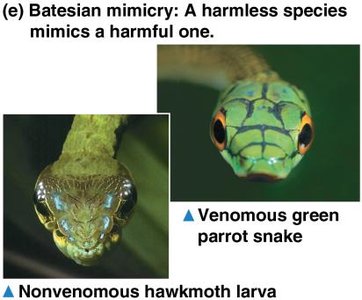
Batesian Mimicry: Harmless species mimics a harmful one.
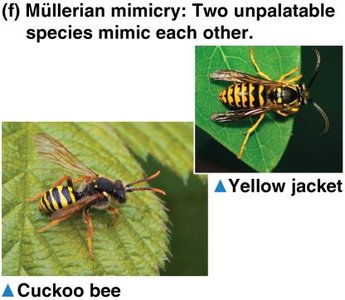
Müllerian Mimicry: Two or more unpalatable species resemble each other.
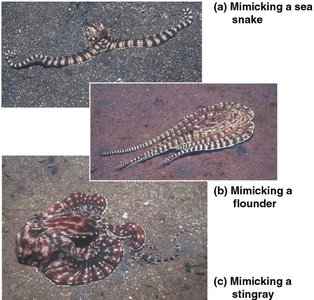
Mimicry in Predators: Some predators mimic harmless species to approach prey.
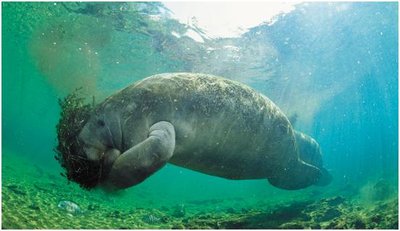
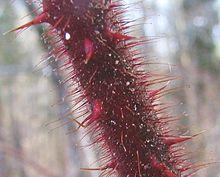
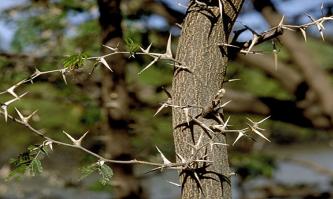
Herbivory: Herbivores eat plants or algae, often with specialized adaptations for feeding and digestion. Plants may have mechanical (spines, thorns) or chemical defenses (toxins, bad taste).
Positive Interactions: Mutualism and Commensalism
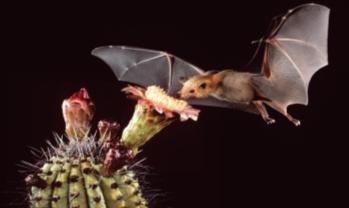
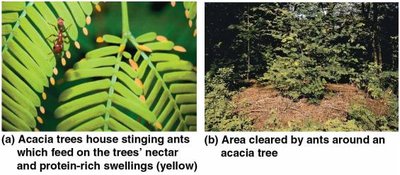
Mutualism (+/+): Both species benefit. Examples: mycorrhizae and plants, mammals and gut bacteria, angiosperms and pollinators, acacia trees and stinging ants.
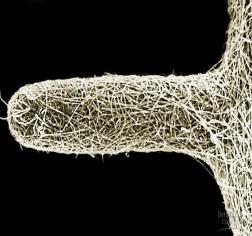
Commensalism (+/0): One species benefits, the other is unaffected. Example: cattle egrets and grazing herbivores.
Ecological Niche and Resource Partitioning
Niche Concepts
The ecological niche is the sum of a species' use of biotic and abiotic resources in its environment.
Fundamental Niche: All possible resources a species could use.
Realized Niche: The actual resources used, limited by competition and other factors.
Resource Partitioning: Differentiation of niches that enables similar species to coexist.
Species Diversity
Components of Species Diversity
Species diversity in a community is measured by:
Species Richness: Number of different species present.
Relative Abundance: Proportion each species represents of the total individuals.
Diversity indices (e.g., Shannon index) are used to compare communities quantitatively.
Trophic Structure
Food Chains and Food Webs
Trophic structure describes the feeding relationships among species in a community.
Food Chain: Linear sequence of energy transfer through trophic levels.
Food Web: Interconnected food chains showing complex feeding relationships.
Functional Groups: Species with similar roles in a community.
Energetic Hypothesis: The length of a food chain is limited by the inefficiency of energy transfer.
Species with Large Impacts
Foundation Species: Have strong effects due to size or abundance.
Keystone Species: Exert strong control by their ecological roles.
Ecosystem Engineers: Create or dramatically alter their environment.
Bottom-Up and Top-Down Controls
Bottom-Up Control: Abundance at each trophic level is limited by nutrient supply or food availability at lower levels.
Top-Down Control: Abundance at each trophic level is controlled by consumers at higher trophic levels.
Disturbance and Community Structure
Disturbance and Succession
Disturbances are events that change communities by removing organisms or altering resource availability.
Intermediate Disturbance Hypothesis: Moderate levels of disturbance foster greater species diversity than high or low levels.
Ecological Succession: The process of species replacement after disturbance.
Primary Succession: Occurs on newly exposed surfaces with no soil.
Secondary Succession: Occurs where a disturbance has removed most but not all organisms.
Biogeography and Island Biogeography
Species-Area Relationships
Species-Area Curve: Larger geographic areas tend to have more species due to greater habitat diversity.
Island Equilibrium Model
The number of species on an island represents a balance between immigration and extinction rates, influenced by island size and distance from the mainland.
Applications: Conservation biology, design of habitat reserves, and understanding patterns of species diversity.
Summary Table: Types of Species Interactions
Interaction Type | Effect on Species 1 | Effect on Species 2 | Example |
|---|---|---|---|
Competition | - | - | Plants competing for light |
Predation | + | - | Owl eating mouse |
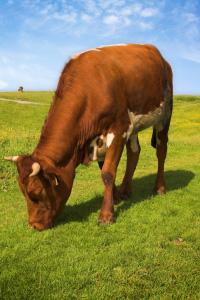
Herbivory | + | - | Cow grazing grass |
Parasitism | + | - | Tick on bird |
Mutualism | + | + | Acacia and ants |
Commensalism | + | 0 | Cattle egret and cow |
