 Back
BackDNA Fingerprinting and Genetics: Laboratory Study Guide
Study Guide - Smart Notes
 Tailored notes based on your materials, expanded with key definitions, examples, and context.
DNA Fingerprinting
Introduction to DNA Fingerprinting
DNA fingerprinting is a molecular technique used to identify individuals based on unique patterns in their DNA. This method is highly accurate and is widely used in forensic science, paternity testing, evolutionary biology, and the identification of individuals in various biological contexts.
Definition: DNA fingerprinting analyzes specific regions of DNA that vary greatly among individuals to produce a unique genetic profile.
Applications: Forensic identification, paternity cases, evolutionary studies, and identification of remains.
Sources of DNA: Blood, hair, semen, saliva, bone marrow, and other tissues.
Historical Methods: RFLP Analysis
Early DNA fingerprinting relied on Restriction Fragment Length Polymorphisms (RFLPs). This method uses restriction enzymes to cut DNA at specific sequences, generating fragments of varying lengths unique to each individual.
Restriction Enzymes: Proteins that recognize and cut DNA at specific nucleotide sequences (restriction sites).
Restriction Fragments: DNA pieces generated by enzyme digestion; their lengths depend on the distance between restriction sites.
RFLPs: Variations in DNA sequence that alter restriction sites, resulting in different fragment patterns among individuals.
Limitations: Requires large amounts of high-quality DNA and is time-consuming.
Modern Methods: PCR-Based STR/VNTR Analysis
Modern DNA fingerprinting uses the Polymerase Chain Reaction (PCR) to amplify regions of DNA containing Short Tandem Repeats (STRs) or Variable Number Tandem Repeats (VNTRs). These regions are highly variable among individuals.
STRs/VNTRs: Short DNA sequences repeated in tandem; the number of repeats varies between individuals.
PCR: Technique to make millions of copies of specific DNA regions, allowing analysis from small or degraded samples.
DNA Profile: The combined pattern of STRs/VNTRs at multiple locations is unique to each individual.
Gel Electrophoresis
Gel electrophoresis is used to separate DNA fragments by size. DNA samples are loaded into wells in an agarose gel and subjected to an electric field. DNA, being negatively charged, migrates toward the positive electrode. Smaller fragments move faster and farther through the gel matrix than larger ones.
Agarose Gel: A porous matrix derived from algae, used to separate DNA fragments.
Electrophoresis Chamber: Apparatus where the gel is placed and an electric current is applied.
Direction of Movement: DNA moves toward the positive electrode due to its negative charge.
Band Visualization: After separation, DNA bands are visualized to determine fragment sizes and patterns.
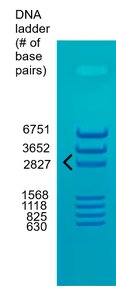
Example: The DNA ladder in the image above provides reference bands of known sizes (in base pairs) to estimate the sizes of sample DNA fragments.
Interpreting Gel Results
The pattern of bands in a gel represents the sizes and concentrations of DNA fragments. Darker bands indicate higher concentrations of fragments of that size. Comparing band patterns between samples allows identification of individuals or matching of crime scene DNA to suspects.
Band Intensity: Indicates the relative amount of DNA of a particular size.
Comparison: Matching band patterns between samples can confirm identity or relatedness.
Laboratory Protocols
Protocols differ slightly depending on whether RFLP or PCR-based methods are used, but both involve preparing the gel, loading DNA samples, running the gel, and visualizing the results.
Gel Preparation: Pour agarose into a casting tray, insert a comb to form wells, and allow to solidify.
Sample Loading: Use a micropipette to load DNA samples into wells.
Running the Gel: Apply an electric current to separate DNA fragments.
Visualization: Use a blue light box to view the separated bands.

Example: The diagram above shows a gel with six wells, ready for loading DNA samples from different sources.
Genetics Practice
Genetic Crosses and Punnett Squares
Punnett squares are used to predict the outcomes of genetic crosses. They show the possible combinations of alleles from the parents and the resulting genotypes and phenotypes of the offspring.
Allele: Different forms of a gene (e.g., B and b for body color in fruit flies).
Genotype: The genetic makeup of an organism (e.g., Bb, BB, or bb).
Phenotype: The observable trait (e.g., brown or black body color).
Dominance: Complete dominance, incomplete dominance, and codominance affect phenotype ratios.
Examples of Genetic Crosses
Complete Dominance: One allele completely masks the effect of the other (e.g., brown body color in fruit flies).
Incomplete Dominance: Heterozygotes show an intermediate phenotype (e.g., pink flowers from red and white alleles).
Codominance: Both alleles are expressed equally in heterozygotes (e.g., black and white feathers in chickens).
Sample Punnett Square Analysis
Fruit Flies (Bb x Bb): Brown (B) is dominant to black (b).
Phenotype Ratio: 3 brown : 1 black
Genotype Ratio: 1 BB : 2 Bb : 1 bb
Horses (AA x Aa): Smooth mane (A) is dominant to curly (a).
Percent Smooth Mane: 100% (AA and Aa both have smooth manes)
Flowers (Rr x rr): Incomplete dominance; red (R), white (r).
Phenotype Ratio: 1 pink : 1 white
Genotype Ratio: 1 Rr : 1 rr
Chickens (XX x XW): Codominance; black (X), white (W).
Percent Black and White Feathers: 50% (XW genotype)
Human Genetics Examples
Mid-digital Hair: Dominant allele (M) causes hair on finger joints.
Cystic Fibrosis: Recessive allele; affected individuals are homozygous recessive (ff).
Huntington's Disease: Dominant allele; heterozygotes (Hh) are affected.
Key Concepts in Genetics
Nucleotide Structure: Each nucleotide consists of three parts:
A phosphate group
A deoxyribose (in DNA) or ribose (in RNA) sugar
A nitrogenous base (adenine, thymine, cytosine, guanine in DNA; uracil replaces thymine in RNA)
DNA vs. RNA: DNA is double-stranded, contains deoxyribose, and uses thymine; RNA is single-stranded, contains ribose, and uses uracil.
Why Multiple Bands Are Compared in DNA Fingerprinting
Comparing multiple bands (loci) increases the accuracy of DNA fingerprinting. The probability that two unrelated individuals share the same pattern at several loci is extremely low, making the identification highly reliable.
Summary Table: Types of Genetic Inheritance
Type | Genotype | Phenotype | Example |
|---|---|---|---|
Complete Dominance | AA, Aa, aa | Dominant or recessive trait | Fruit fly body color |
Incomplete Dominance | RR, Rr, rr | Intermediate phenotype | Flower color (pink) |
Codominance | XX, XW, WW | Both traits expressed | Chicken feather color |
Key Equations
Probability of Offspring Genotype (Punnett Square):
Additional info: This guide expands on the laboratory procedures and genetic concepts to provide a comprehensive overview suitable for exam preparation in a college-level biology course.
