 Back
BackDNA Structure and Chargaff’s Rules: Foundations of Molecular Genetics
Study Guide - Smart Notes
 Tailored notes based on your materials, expanded with key definitions, examples, and context.
Nucleic Acid and DNA Structure
Overview of DNA Structure
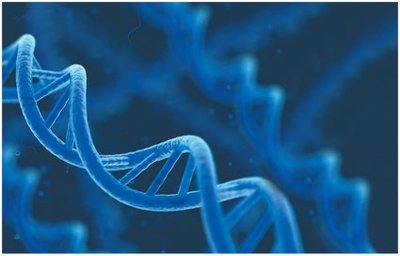
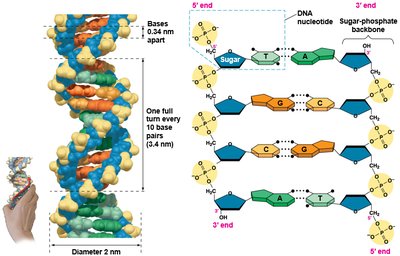
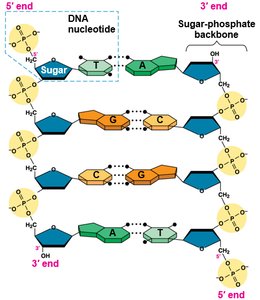
DNA (deoxyribonucleic acid) is the hereditary material in almost all living organisms. Its structure is fundamental to understanding genetic information storage and transmission. DNA is a polymer composed of nucleotide monomers, each containing a phosphate group, a deoxyribose sugar, and a nitrogenous base.
Nucleotides: The building blocks of DNA, consisting of a phosphate, a sugar (deoxyribose), and a nitrogenous base (adenine, thymine, guanine, or cytosine).
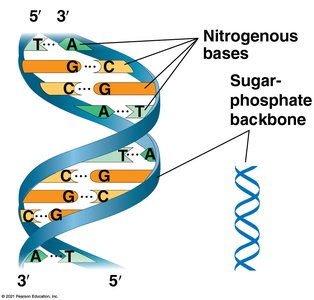
Double Helix: DNA forms a double helix, with two strands wound around each other.
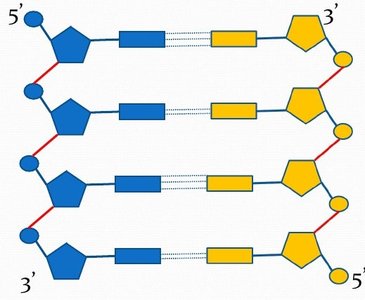
Antiparallel Strands: The two DNA strands run in opposite directions (5' to 3' and 3' to 5').
Sugar-Phosphate Backbone: The backbone is formed by alternating sugar and phosphate groups, which are hydrophilic and face outward.
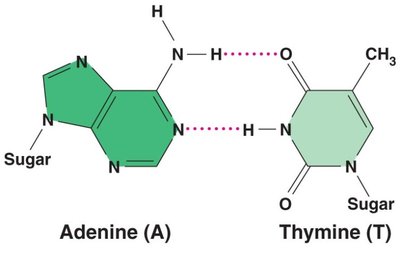
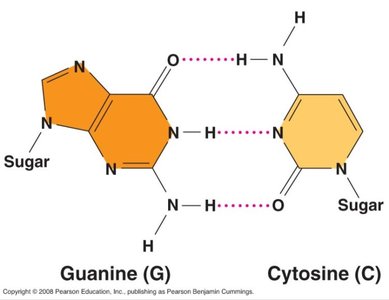
Base Pairing: Nitrogenous bases pair via hydrogen bonds: adenine (A) pairs with thymine (T), and guanine (G) pairs with cytosine (C).
Chargaff’s Rules
Base Composition and Pairing
Erwin Chargaff’s research in the 1950s established two key rules about DNA base composition, which were critical for understanding its structure:
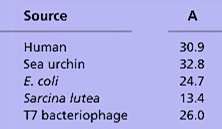
Rule 1: The base composition of DNA varies between species.
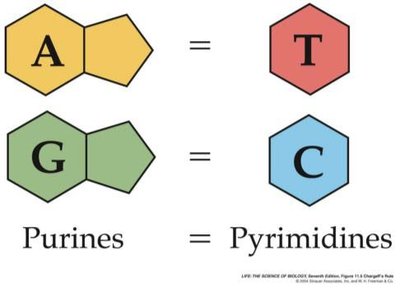
Rule 2: Within a species, the amount of adenine equals thymine (A = T), and the amount of guanine equals cytosine (G = C).
These rules provided evidence for the pairing mechanism in DNA and supported the double helix model.
Base Pairing and Chemical Structure
The pairing of purines (A, G) with pyrimidines (T, C) ensures the uniform width of the DNA molecule. Hydrogen bonds stabilize these pairs: A-T pairs have two hydrogen bonds, while G-C pairs have three.
Purines: Adenine (A) and Guanine (G)
Pyrimidines: Thymine (T) and Cytosine (C)
Hydrogen Bonding: A-T pairs (2 bonds), G-C pairs (3 bonds)
Evidence That DNA Is the Genetic Material
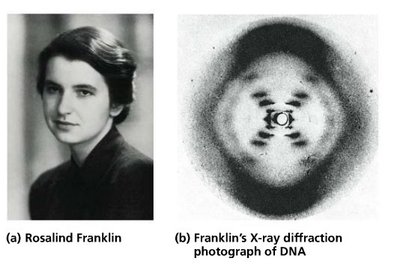
X-ray Diffraction and Structural Determination
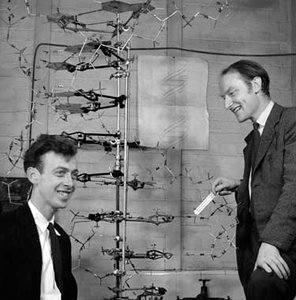
X-ray diffraction studies, particularly those by Rosalind Franklin, revealed the helical structure of DNA. The diffraction pattern indicated a repeating structure, supporting the double helix model proposed by Watson and Crick.
X-ray Diffraction: Provided evidence for the helical structure and regular spacing of bases.
Model Building: Watson and Crick used this data, along with Chargaff’s rules, to build the double helix model.
DNA Double Helix: Structural Features
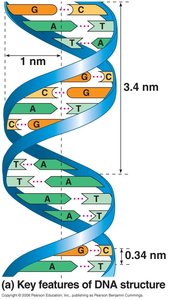
Physical Dimensions and Organization
The double helix has specific physical dimensions and organizational features:
Diameter: 2 nm
Distance Between Base Pairs: 0.34 nm
One Full Turn: Every 10 base pairs (3.4 nm)
Central Core: Bases are located in the interior, paired via hydrogen bonds.
Backbone: Sugar-phosphate backbone is on the outside, interacting with the aqueous environment.
DNA Directionality and Antiparallel Strands
5' and 3' Ends
Each DNA strand has directionality, defined by the 5' (phosphate) and 3' (hydroxyl) ends. The two strands are antiparallel, meaning they run in opposite directions. This orientation is crucial for DNA replication and transcription.
Antiparallel: One strand runs 5' to 3', the other 3' to 5'.
Backbone: Sugar-phosphate backbone runs in opposite directions on each strand.
Application of Chargaff’s Rules
Calculating Base Percentages
Chargaff’s rules allow for the calculation of nucleotide percentages in DNA samples. For example, if cytosine makes up 32% of the nucleotides, guanine will also be 32%. The remaining 36% will be split equally between adenine and thymine (18% each).
Example: If DNA contains 23% guanine, then cytosine is also 23%. The remaining 54% is divided equally between adenine and thymine (27% each).
Base | Percentage |
|---|---|
Guanine (G) | 23% |
Cytosine (C) | 23% |
Adenine (A) | 27% |
Thymine (T) | 27% |
Formula: For double-stranded DNA, and .
Summary Table: DNA Base Composition in Different Species
Comparative Analysis
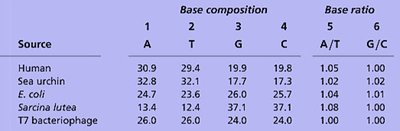
The base composition of DNA varies between species, as shown in the following table:
Source | A (%) | T (%) | G (%) | C (%) | A/T Ratio | G/C Ratio |
|---|---|---|---|---|---|---|
Human | 30.9 | 29.4 | 19.9 | 19.8 | 1.05 | 1.00 |
Sea urchin | 32.8 | 32.1 | 17.7 | 17.3 | 1.02 | 1.02 |
E. coli | 24.7 | 23.6 | 26.0 | 25.7 | 1.04 | 1.01 |
Sarcina lutea | 13.4 | 12.4 | 37.1 | 37.1 | 1.08 | 1.00 |
T7 bacteriophage | 26.0 | 26.0 | 24.0 | 24.0 | 1.00 | 1.00 |
Key Concepts and Equations
Chargaff’s Equations: , ,
DNA Structure: Double helix, antiparallel strands, sugar-phosphate backbone, hydrogen-bonded base pairs
Species Variation: Base composition varies between species, supporting the universality and diversity of genetic material
Example: In a DNA sample with 32% cytosine, guanine will also be 32%, and adenine and thymine will each be 18%.
Additional info: The notes above expand on the original content by providing definitions, examples, and structural context for DNA, as well as the application of Chargaff’s rules in calculating base composition.
----------------------------------------
