 Back
DNA Structure and Replication: Key Concepts and Data Interpretation
Study Guide - Smart Notes
 Tailored notes based on your materials, expanded with key definitions, examples, and context.
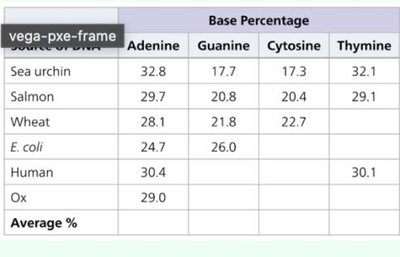
Q5. Analyze the data table showing the base percentages of DNA from different species. What patterns do you observe regarding the relationship between adenine and thymine, and between guanine and cytosine? How do the percentages vary between species?
Background
Topic: DNA Structure and Base Pairing (Chargaff's Rules)
This question tests your understanding of Chargaff's Rules, which describe the relationships between the four nitrogenous bases in DNA (adenine, thymine, guanine, cytosine) and how these relationships are reflected in the DNA of different species.
Key Terms and Concepts
Chargaff's Rules: In any DNA sample, the amount of adenine (A) is approximately equal to thymine (T), and the amount of guanine (G) is approximately equal to cytosine (C).
Base Pairing: A pairs with T via two hydrogen bonds; G pairs with C via three hydrogen bonds.
Species Variation: The overall percentages of each base can vary between species, but the A=T and G=C relationships hold within each species.
Step-by-Step Guidance
Examine the data table for each species and compare the percentages of adenine (A) and thymine (T). Notice whether these values are close to each other for each species.
Next, compare the percentages of guanine (G) and cytosine (C) for each species. Are these values also similar within each species?
Observe how the total percentages of each base (A, T, G, C) differ between species. For example, does one species have a higher percentage of A and T compared to another?
Think about what these patterns suggest about the universality of base pairing rules and the diversity of DNA composition among different organisms.
Consider why these relationships are important for the structure of the DNA double helix and for accurate DNA replication.
Try solving on your own before revealing the answer!
Final Answer:
For each species, the percentage of adenine (A) is approximately equal to thymine (T), and the percentage of guanine (G) is approximately equal to cytosine (C). For example, in sea urchin DNA, A = 32.8% and T = 32.1%; G = 17.7% and C = 17.3%. This pattern holds for all species in the table, illustrating Chargaff's Rules.
However, the overall percentages of each base vary between species. For instance, E. coli has lower A and T percentages compared to sea urchin or human DNA. This shows that while the base pairing rules are universal, the base composition is species-specific.
This pattern is crucial for the double helix structure, as it ensures complementary base pairing and accurate DNA replication.
