 Back
Earth’s Diverse Ecosystems: Study Guide for Biology Final Exam
Study Guide - Smart Notes
 Tailored notes based on your materials, expanded with key definitions, examples, and context.
Earth’s Diverse Ecosystems
Ecosystem Factors
Organisms are distributed across Earth based on several key environmental factors. These factors determine the suitability of habitats for different species and influence the structure and function of ecosystems.
Sunlight: Essential for photosynthesis and energy flow in ecosystems.
Temperature: Influences metabolic rates and species distribution.
Water Availability: Critical for all life; limits growth in arid regions.
Nutrients: Required for growth and development; their availability shapes ecosystem productivity.
Land Ecosystems: Temperature and precipitation are the most important factors.
Aquatic Ecosystems: Light and nutrient availability are key.
Solar Energy and the Ozone Layer
Solar energy is the primary driver of climate and life processes on Earth. The ozone layer plays a crucial role in protecting living organisms from harmful ultraviolet (UV) radiation.
Solar Energy: Powers climate systems; only about 1% is used by living organisms for photosynthesis.
Ozone Layer: Absorbs UV radiation, protecting DNA and life from damage.
Ozone Depletion: Increases exposure to harmful radiation, threatening ecosystems.
Biomes
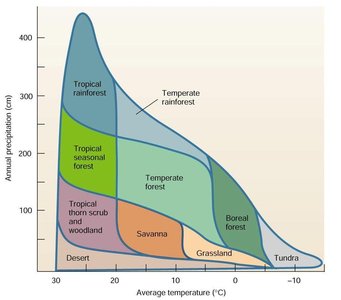
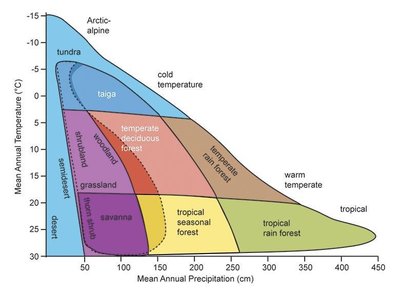
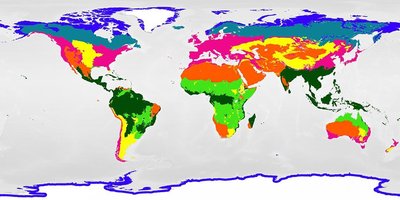
Biomes are large ecological regions characterized by specific climate conditions, vegetation, and animal life. Temperature and rainfall are the primary determinants of biome distribution.
Tropical Rainforest: Highest biodiversity, high rainfall; threatened by deforestation.
Savanna: Grasslands with scattered trees, large animals; impacted by poaching, overgrazing, and population growth.
Desert: Low precipitation, slow recovery; vulnerable to land damage and desertification.
Grasslands: Fertile soil; endangered by farming and overgrazing.
Temperate Forest: Moderate climate; affected by logging and habitat loss.
Tundra/Coniferous Forest: Cold environments, low biodiversity.
Keystone Species: Species whose removal causes ecosystem collapse.
Aquatic Ecosystems
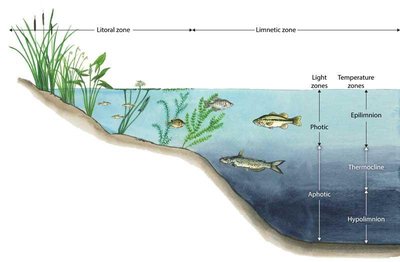
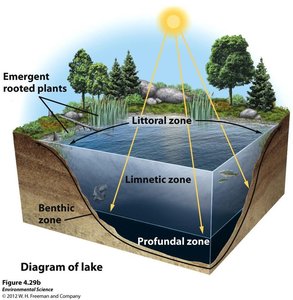
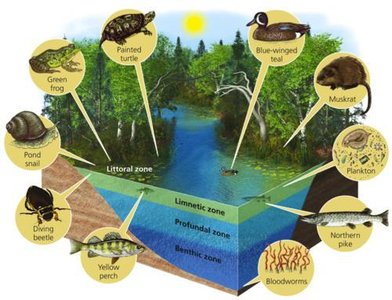
Aquatic ecosystems are structured into distinct zones based on depth, light penetration, and temperature. These zones influence the distribution of organisms and ecosystem processes.
Littoral Zone: Near shore, most life and plant growth.
Limnetic Zone: Open water, photosynthesis occurs.
Profundal Zone: Deep water, little or no light.
Oligotrophic vs Eutrophic Lakes
Lakes are classified based on nutrient levels and biological productivity. These classifications affect water clarity, plant growth, and ecosystem health.
Type | Description |
|---|---|
Oligotrophic | Low nutrients, clear water |
Eutrophic | High nutrients, abundant plant growth |
Eutrophication
Eutrophication is a process where excess nutrients, often from fertilizer runoff, lead to rapid plant and algal growth in aquatic systems. This disrupts ecosystem balance and can cause dead zones.
Cause: Fertilizer runoff increases nutrient levels.
Effects: Algae blooms, oxygen depletion, fish die-offs.
Marine Ecosystems
Marine ecosystems are divided into zones based on light availability and depth. These zones determine the types of organisms present and the energy flow within the ecosystem.
Photic Zone: Sunlight penetrates, photosynthesis occurs.
Aphotic Zone: No sunlight, low energy.
Deep Ocean: Limited sunlight, low productivity.
Human Impacts on Ecosystems
Human activities have significant effects on ecosystems, often leading to environmental degradation and loss of biodiversity.
Climate Change: Alters temperature and precipitation patterns.
Deforestation: Reduces biodiversity and disrupts habitats.
Desertification: Expansion of deserts due to land misuse.
Eutrophication: Nutrient pollution in aquatic systems.
Ozone Depletion: Increases UV radiation exposure.
Summary Checklist
Ecosystem factors
Ozone layer
Major biomes and examples
Human impacts for each biome
Keystone species
Lake zones
Eutrophication
Additional info:
Biomes are often illustrated using climate diagrams that plot average temperature against precipitation, showing how these factors define biome boundaries. Aquatic zones are depicted in cross-sectional diagrams, highlighting the distribution of organisms and light/temperature gradients.
