 Back
BackEcology and Biochemistry: Foundations of Life and the Environment
Study Guide - Smart Notes
 Tailored notes based on your materials, expanded with key definitions, examples, and context.
Ecology
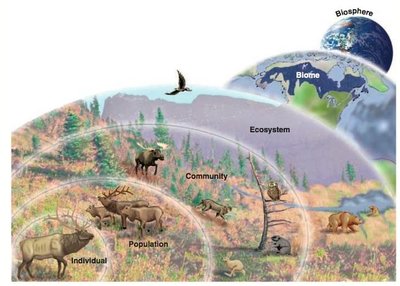
Levels of Ecological Organization
Ecology studies the interactions between organisms and their environment, organized into hierarchical levels:
Individual Organism: A single living being.
Population: All individuals of a species in a given area.
Community: All living organisms (different species) in an area.
Ecosystem: The community plus abiotic (non-living) factors.
Biome: Large regions defined by climate and vegetation.
Biosphere: The entire Earth and all its ecosystems.
Components of an Ecosystem
Biotic Factors: Living or once-living components (plants, animals, fungi, bacteria, dead organic matter).
Abiotic Factors: Non-living components (water, sunlight, temperature, soil, air).
Energy Flow in Ecosystems
Energy moves through ecosystems in a structured manner:
Food Chain: A linear sequence showing energy transfer from one organism to another.
Food Web: A complex network of interconnected food chains in an ecosystem.
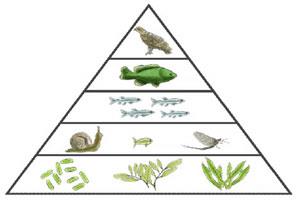
Energy Pyramid: Illustrates the distribution of energy and biomass among trophic levels.
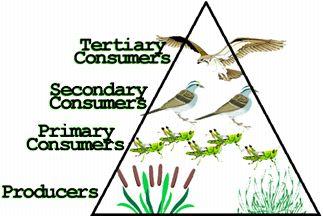
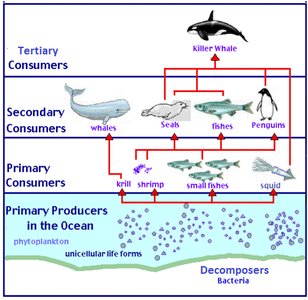
Trophic Levels
Producers (Autotrophs): Photosynthetic organisms (e.g., plants, algae) that form the base of the pyramid.
Primary Consumers: Herbivores that eat producers.
Secondary Consumers: Carnivores/omnivores that eat primary consumers.
Tertiary Consumers: Top predators that eat secondary consumers.
Producers have the greatest biomass; higher trophic levels have less biomass due to energy loss at each step.
Symbiosis
Symbiosis describes close relationships between different species:
Mutualism: Both organisms benefit (e.g., pollinating insects and flowers).
Commensalism: One benefits, the other is unaffected (e.g., barnacles on whales).
Parasitism: One benefits, the other is harmed (e.g., fleas on dogs).
Population Ecology
Population ecology examines how populations change over time:
Immigration: Movement into a population.
Emigration: Movement out of a population.
Carrying Capacity: Maximum population size an environment can support.
Limiting Factors: Environmental factors that restrict population growth (e.g., food, space, predation).
Density-Dependent vs. Density-Independent Factors
Density-Dependent: Effects increase with population density (e.g., disease, competition).
Density-Independent: Effects are unrelated to population density (e.g., natural disasters).
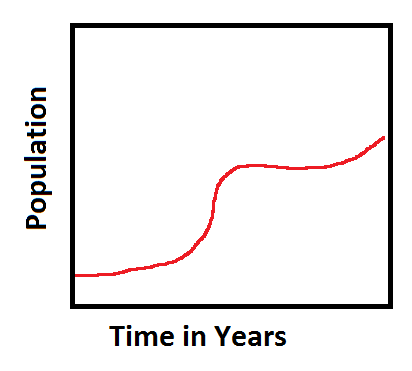
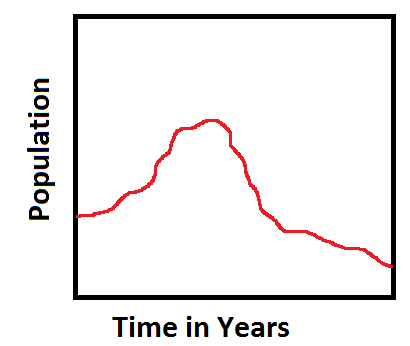
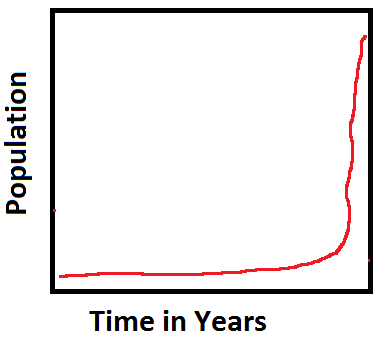
Population Growth Curves
Exponential Growth: Rapid increase without limiting factors.
Logistic Growth: Growth slows as carrying capacity is reached.
Biogeochemical Cycles
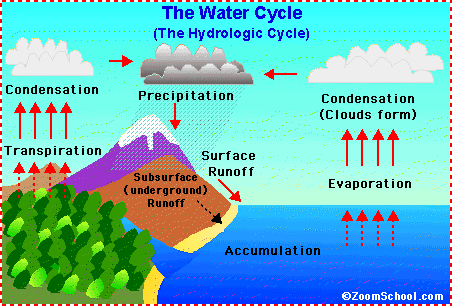
The Water Cycle (Hydrologic Cycle)
Describes the continuous movement of water on, above, and below the surface of the Earth:
Precipitation (rain/snow) falls to Earth.
Water collects in bodies of water or infiltrates the ground.
Evaporation and transpiration return water to the atmosphere.
Condensation forms clouds, leading to precipitation again.
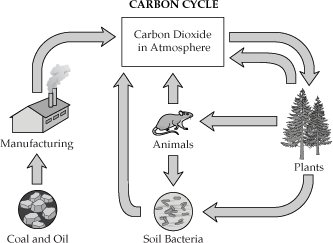
The Carbon Cycle
Carbon moves between the atmosphere, organisms, and the Earth:
Photosynthesis converts CO2 into organic molecules in plants.
Consumers eat plants, transferring carbon.
Respiration and decomposition return CO2 to the atmosphere.
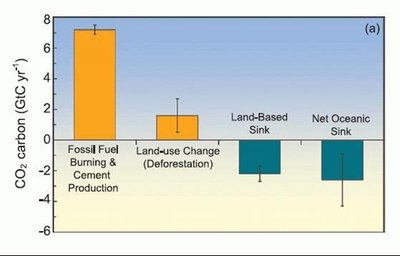
Fossil fuel burning and deforestation release stored carbon.
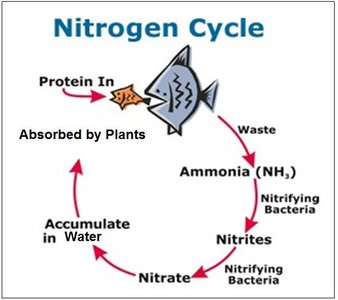
The Nitrogen Cycle
Nitrogen is essential for proteins and nucleic acids but must be converted to usable forms:
Nitrogen Fixation: Bacteria convert N2 gas to ammonia (NH3).
Nitrification: Ammonia is converted to nitrate (NO3-).
Plants absorb nitrate; animals obtain nitrogen by eating plants/animals.
Decomposition and waste return nitrogen to the soil.
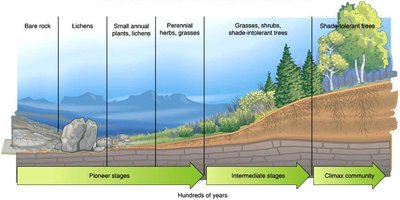
Succession in Ecosystems
Succession is the process of change in species structure in an ecosystem over time:
Primary Succession: Begins on bare rock; pioneer species (lichens, mosses) colonize first.
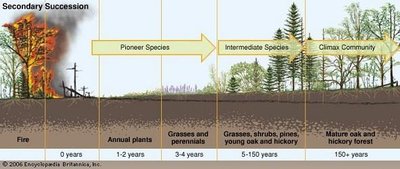
Secondary Succession: Occurs after a disturbance (e.g., fire); soil is already present.
Climax Community: Stable, mature community with high biodiversity.
Human Impacts on Ecosystems
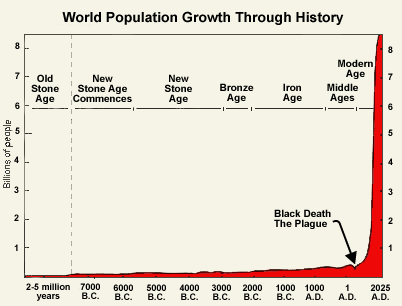
Population Growth: Human population has grown exponentially due to technology, medicine, and agriculture.
Resource Use: Non-renewable resources (fossil fuels) are depleted faster than they form; renewable resources (solar, wind) can be replenished.
Pollution: Introduction of harmful substances into air, water, or soil; leads to health problems, acid rain, and climate change.
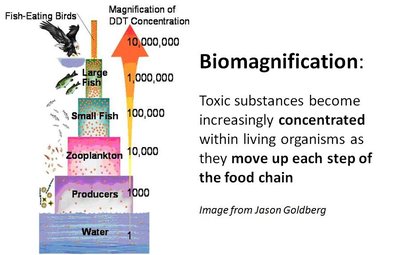
Biomagnification: Pollutants become more concentrated as they move up the food chain.
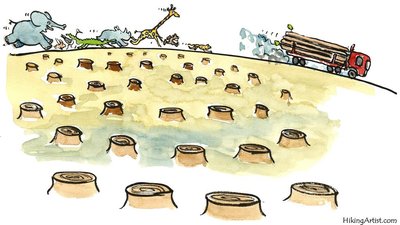
Deforestation: Destruction of forests leads to habitat loss and increased atmospheric CO2.
Conservation: Sustainable management of resources and protection of species and habitats.
Biochemistry
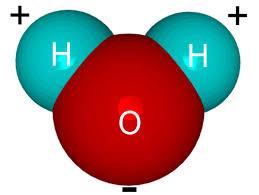
The Water Molecule
Water is essential for life due to its unique chemical properties:
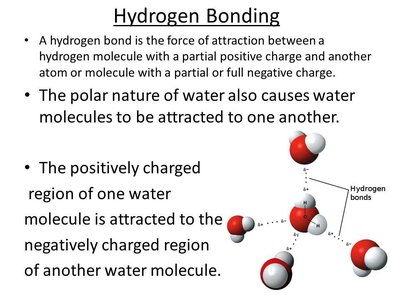
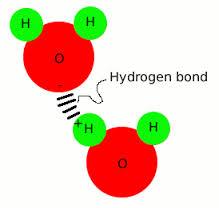
Polar Molecule: Unequal sharing of electrons creates partial charges.
Hydrogen Bonds: Weak attractions between water molecules due to polarity.
Unique Properties of Water
High Specific Heat: Resists temperature changes.
Cohesion: Water molecules stick to each other (surface tension).
Adhesion: Water molecules stick to other substances.
Universal Solvent: Dissolves many substances.
Ice is Less Dense: Solid water floats on liquid water.
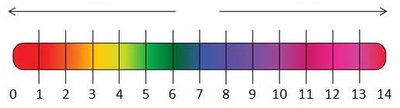
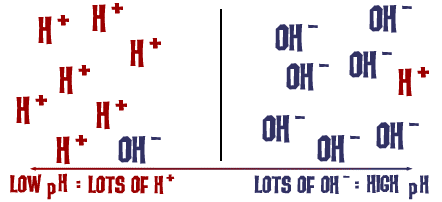
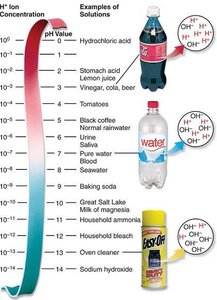
pH Scale
The pH scale measures the concentration of hydrogen ions (H+) in a solution:
Acid: pH < 7 (more H+ ions)
Neutral: pH = 7 (pure water)
Base (Alkaline): pH > 7 (more OH- ions)
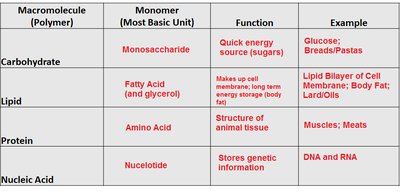
Macromolecules
All living things are composed of four main types of macromolecules:
Macromolecule (Polymer) | Monomer (Most Basic Unit) | Function | Example |
|---|---|---|---|
Carbohydrate | Monosaccharide | Quick energy source (sugars) | Glucose, Breads/Pastas |
Lipid | Fatty Acid (and glycerol) | Cell membrane structure, long-term energy storage | Body fat, oils, cell membranes |
Protein | Amino Acid | Structure, enzymes, transport | Muscles, enzymes |
Nucleic Acid | Nucleotide | Stores genetic information | DNA, RNA |
Enzymes and Chemical Reactions
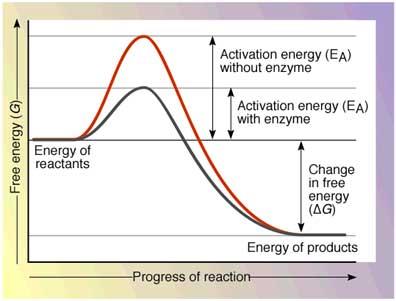
Enzymes are biological catalysts that speed up chemical reactions by lowering activation energy.
Activation Energy: The minimum energy required to start a reaction.
Enzyme-Substrate Complex: The enzyme binds to its substrate at the active site, facilitating the reaction.
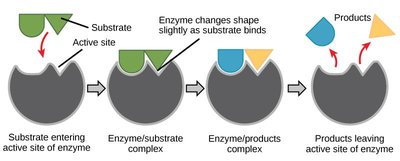
Enzymes are essential for life because they allow reactions to occur rapidly and at lower temperatures.
