 Back
BackEcology and Human Impacts on the Biosphere: Study Guide
Study Guide - Smart Notes
 Tailored notes based on your materials, expanded with key definitions, examples, and context.
Ecology and Human Impacts on the Biosphere
The Scientific Method
The scientific method is a flexible, systematic approach used to investigate natural phenomena and answer scientific questions. It is foundational to all biological research and ensures that findings are reliable and reproducible.
Observation: The process begins with making observations about the world, identifying patterns or cause-and-effect relationships.
Hypothesis: A tentative explanation for observed phenomena, which must be testable and falsifiable.
Experimentation: Designing experiments to test hypotheses, including the use of experimental and control groups, and careful control of variables.
Variables:
Independent variable: The factor that is changed or manipulated.
Dependent variable: The factor that is measured or observed.
Conclusion and Revision: Drawing conclusions from data, revising hypotheses as needed, and subjecting findings to peer review.
Importance of Revision: Revision allows for the correction of errors, refinement of ideas, and improvement of scientific understanding through peer feedback.
Introduction to Ecology
Definition and Scope
Biology is the science of life, encompassing many branches such as ecology, genetics, and physiology. Ecology specifically studies how organisms interact with each other and their environment, across multiple levels of organization:
Individual: A single organism (e.g., a tree in a forest).
Population: A group of individuals of the same species in an area (e.g., fish in a pond).
Community: All populations of different species in an area (e.g., plants, animals, and microbes in a meadow).
Ecosystem: A community plus its nonliving environment (e.g., coral reef with fish, coral, water, and sand).
Biosphere: The global sum of all ecosystems (e.g., Earth as a living system).
Ecosystem Structure and Function
Biotic and Abiotic Components
Ecosystems consist of living (biotic) and nonliving (abiotic) components. Biotic factors include plants, animals, and microbes, while abiotic factors include sunlight, water, soil, and temperature.
Energy and Chemical Flow in Ecosystems
Energy flows through ecosystems in a one-way stream, primarily from the sun, while chemicals are recycled. The movement of energy is organized into trophic levels:
Producers (Autotrophs): Organisms (e.g., plants) that convert solar energy into chemical energy via photosynthesis.
Primary Consumers (Herbivores): Eat producers (e.g., rabbits).
Secondary Consumers (Carnivores): Eat primary consumers (e.g., snakes).
Tertiary Consumers: Eat secondary consumers (e.g., hawks).
Omnivores: Eat both plants and animals (e.g., humans).
Detritivores: Consume dead organic matter (e.g., earthworms).
Decomposers: Break down dead material, recycling nutrients (e.g., fungi, bacteria).
Food Chains vs. Food Webs
Food Chain: A linear sequence showing who eats whom.
Food Web: A complex network of interconnected food chains, illustrating the multiple pathways through which energy and nutrients flow.
Food webs demonstrate the interdependence of organisms and the impact of changes in one part of the ecosystem on others.
Energy Pyramids and Trophic Efficiency
Energy Transfer and Biomass
Energy pyramids illustrate the inefficiency of energy transfer between trophic levels. Only about 10% of the energy at one level is converted to biomass at the next level; the rest is lost as heat, waste, or used for metabolism. This explains why there are more plants than animals in ecosystems.
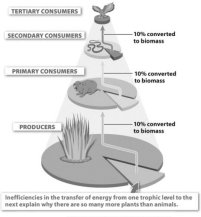
Biomass refers to the total mass of living organisms in a given area. The shape of the energy pyramid is primarily determined by the abundance of producers at the base.
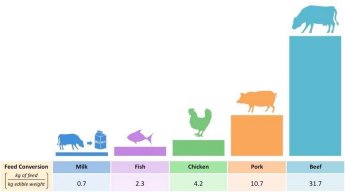
Feed Conversion and Food Choices
Feed conversion ratios show how much feed is required to produce a unit of edible animal product. Meat, especially beef, requires much more feed than plant-based foods, making it less energy-efficient and more resource-intensive.
Photosynthesis and Cellular Respiration
Photosynthesis
Photosynthesis is the process by which plants, algae, and some bacteria convert sunlight, water, and carbon dioxide into glucose and oxygen. It occurs in the chloroplasts of plant cells, using the pigment chlorophyll to capture light energy.
Inputs: Sunlight, water (from soil), carbon dioxide (from air)
Outputs: Glucose (sugar), oxygen
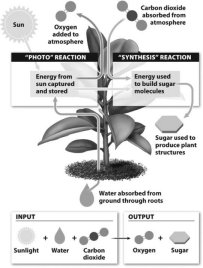
The overall equation for photosynthesis is:
Significance: Photosynthesis provides the energy and organic molecules that fuel nearly all life on Earth and is the primary source of atmospheric oxygen.
Cellular Respiration
Cellular respiration is the process by which living organisms extract energy from glucose, producing ATP, water, and carbon dioxide. It occurs in the mitochondria of cells and is performed by nearly all organisms, including plants, animals, and fungi.
Inputs: Glucose, oxygen
Outputs: Carbon dioxide, water, ATP (energy)
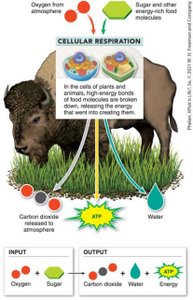
The overall equation for cellular respiration is:
Significance: Cellular respiration provides the energy required for all cellular activities. The CO2 produced is recycled by plants during photosynthesis.
Human Impact on Ecosystems
Modern Agriculture and Bioaccumulation
Modern agriculture often relies on unsustainable practices such as monoculture, heavy irrigation, and pesticide use, leading to loss of biodiversity, soil degradation, and pollution. Bioaccumulation refers to the buildup of toxic substances in organisms, which increases at higher trophic levels and can harm wildlife and humans.
Fossil Fuels and the Carbon Cycle
The carbon cycle describes the movement of carbon through the biosphere, atmosphere, and geosphere. Human activities, especially the burning of fossil fuels and deforestation, disrupt the natural balance, increasing atmospheric CO2 and contributing to climate change.
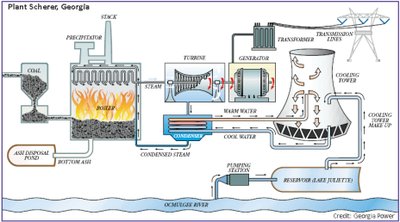
Electricity Generation from Coal
Coal-fired power plants generate electricity by burning coal to produce steam, which turns turbines connected to generators. This process releases large amounts of CO2 and other pollutants.
Climate Change and the Greenhouse Effect
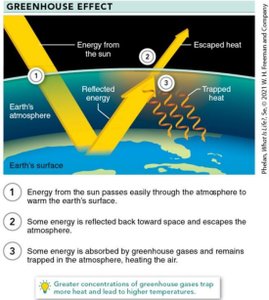
Greenhouse Effect
The greenhouse effect is the warming of Earth's atmosphere due to the trapping of heat by greenhouse gases such as CO2, methane, and nitrous oxide. While necessary for life, excessive greenhouse gases lead to global warming and climate change.
Effects of Climate Change: Sea level rise, altered weather patterns, melting ice, changes in species distributions, and increased frequency of extreme events.
Mitigation: Reducing fossil fuel use, increasing energy efficiency, reforestation, and transitioning to renewable energy sources.
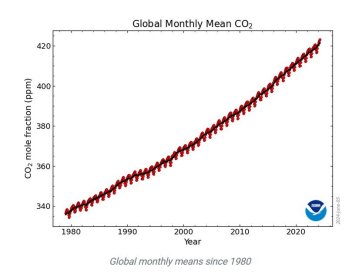
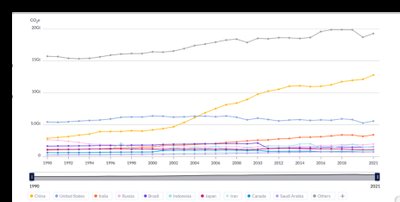
Global CO2 Levels
Atmospheric CO2 concentrations have risen sharply since the Industrial Revolution, correlating with increased fossil fuel use and deforestation.
Sources of Greenhouse Gas Emissions
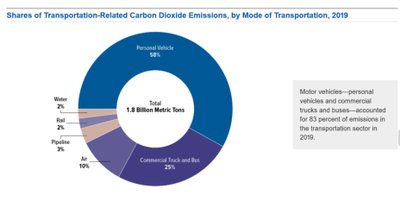
Major sources of greenhouse gas emissions include transportation, electricity generation, industry, and agriculture. Carbon dioxide is the most significant greenhouse gas by volume.
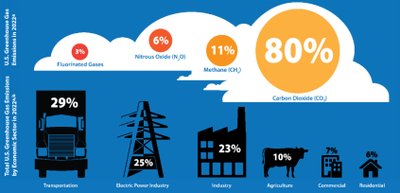
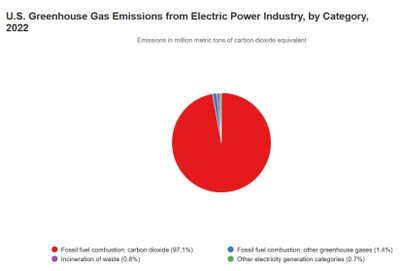
Transportation and Electricity Emissions
Personal vehicles and commercial trucks are the largest contributors to transportation-related CO2 emissions. Most U.S. electricity is produced by burning fossil fuels, especially coal and natural gas.
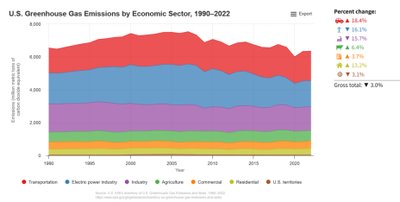
Trends in U.S. and Global Emissions
U.S. greenhouse gas emissions have fluctuated, with some sectors showing decreases due to improved efficiency and cleaner energy sources. Globally, emissions are rising fastest in developing countries such as China and India.
Alternative Energy and Resource Management
Alternative Energy Sources
Solar Energy: Converts sunlight into electricity.
Wind Power: Uses wind turbines to generate electricity.
Hydroelectric Power: Harnesses moving water to turn turbines.
Nuclear Power: Uses nuclear reactions to generate heat and electricity.
Reducing CO2 Emissions
Energy Efficiency: Using energy-efficient appliances and insulation reduces energy consumption and emissions.

Mitigating Deforestation: Planting trees and preserving forests increases carbon sequestration.
Natural Resources: Renewable vs. Nonrenewable
Resource Type | Renewability | Examples | Environmental Impact |
|---|---|---|---|
Renewable | Can be replenished | Solar, Wind, Biomass | Lower, if managed properly |
Nonrenewable | Finite | Coal, Oil, Natural Gas | Higher, due to extraction and pollution |
Ecological Footprints and Population Ecology
Ecological Footprints
An ecological footprint measures the environmental impact of an individual or population, expressed as the amount of land and resources required to sustain their lifestyle and absorb their waste.
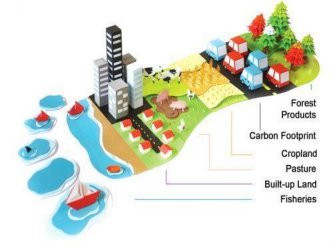
Ecosystem services are the benefits provided by natural ecosystems, such as nutrient cycling, water purification, and recreation.
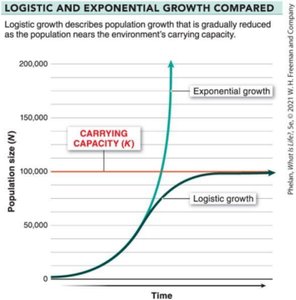
Population Growth and Regulation
Exponential Growth: Population increases rapidly without limits, forming a J-shaped curve.
Logistic Growth: Population growth slows as it approaches the carrying capacity (K) of the environment, forming an S-shaped curve.
Carrying Capacity: The maximum population size that an environment can sustain long-term.
Density-dependent factors: Effects increase with population density (e.g., competition, disease).
Density-independent factors: Effects are unrelated to population size (e.g., natural disasters).
Fertility Rate and Age Pyramids
Total Fertility Rate (TFR): Average number of children per woman. Replacement TFR is about 2.1.
Age Pyramids: Visual representations of population age structure, indicating whether a population is growing, stable, or declining.
Summary: Understanding ecological principles and human impacts is essential for managing resources, mitigating climate change, and ensuring a sustainable future for all life on Earth.
