 Back
BackEcology: Interactions, Energy Flow, and Population Dynamics
Study Guide - Smart Notes
 Tailored notes based on your materials, expanded with key definitions, examples, and context.
Ecology: The Study of Interactions
Definition and Scope
Ecology is the scientific study of interactions between living (biotic) and nonliving (abiotic) factors in the environment. These interactions shape the distribution and abundance of organisms.
Biotic factors: Living components such as parasites, other organisms, and competitors.
Abiotic factors: Nonliving components such as water, temperature, and soil.
Levels of Ecological Organization
Hierarchy of Biological Systems
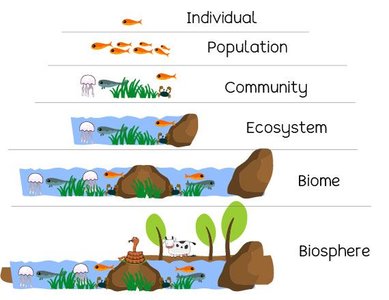
Ecological study is organized into several hierarchical levels, each with increasing complexity:
Individual: A single organism.
Population: A group of individuals of the same species living in the same area.
Community: All the living organisms in a particular area.
Ecosystem: The community plus the abiotic environment.
Biome: Large regions characterized by specific climate and communities.
Biosphere: The sum of all ecosystems on Earth.
Response to Environment
Animal Behavior
Animals respond to environmental stimuli through behaviors, which can be innate or learned. Natural selection favors behaviors that increase survival and reproductive success.
Innate behavior: Inherited, automatic, and consistent (e.g., migration).
Learned behavior: Develops through experience and environmental interaction (e.g., language acquisition).
Plant Responses (Tropisms)
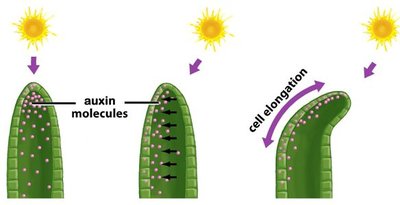
Plants respond to environmental stimuli through tropisms, which are directional growth responses.
Phototropism: Growth towards light.
Photoperiodism: Flowering in response to light duration.
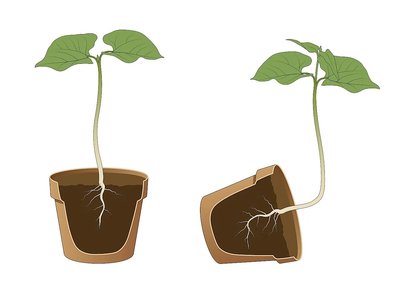
Gravitropism (Geotropism): Growth in response to gravity.
Hydrotropism: Growth towards water.
Responses can be positive (towards stimulus) or negative (away from stimulus).
Energy Flow in Ecosystems
Key Terms and Trophic Structure
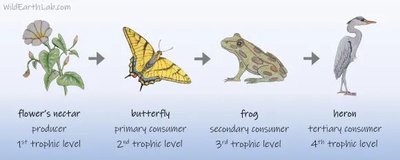
Energy flows through ecosystems in a one-way stream, from primary producers to various consumers.
Autotrophs (Producers): Organisms that produce their own food (e.g., plants).
Heterotrophs (Consumers): Organisms that consume other organisms for energy.
Primary consumer: Herbivores that eat producers.
Secondary consumer: Carnivores that eat primary consumers.
Tertiary consumer: Carnivores that eat secondary consumers.
Quaternary consumer: Top-level predators.
Decomposer: Break down dead organic matter (e.g., fungi, bacteria).
Detritivore: Consume detritus (dead organic material).
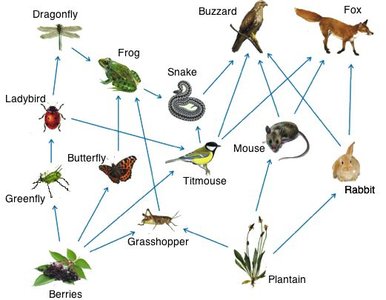
Food Chains and Food Webs
A food chain shows the linear flow of energy from one organism to another, while a food web illustrates interconnected food chains within an ecosystem. Arrows in these diagrams indicate the direction of energy flow.
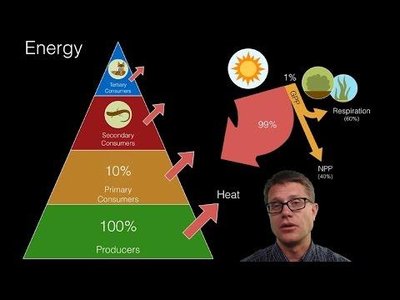
Energy Pyramids and the 10% Rule
An energy pyramid visually represents the amount of energy at each trophic level. Only about 10% of the energy is transferred from one trophic level to the next; the rest is lost as heat.
Producers have the most energy.
Energy decreases at each successive level.
Example: If producers have 90 calories, only 9 calories are available to primary consumers.
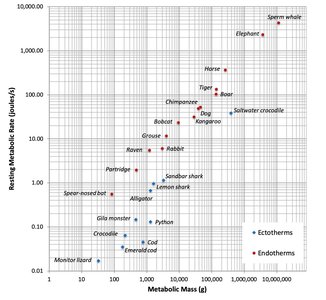
Endotherms vs. Ectotherms
Endotherms (warm-blooded animals) generate heat to maintain body temperature and require more food. Ectotherms (cold-blooded animals) rely on external sources for heat and have lower energy needs.
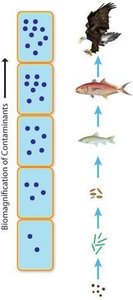
Biomagnification
Biomagnification is the process by which toxins become more concentrated in organisms at higher trophic levels. Top predators receive the highest toxin concentrations.
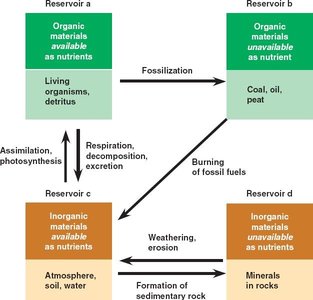
Nutrient Cycling (Biogeochemical Cycles)
Overview
Nutrients cycle between living organisms and the abiotic environment, changing forms but never being created or destroyed.
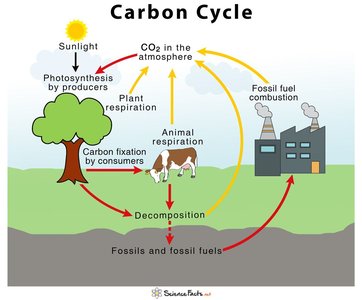
Carbon Cycle
Abiotic reservoir: CO2 in the atmosphere.
Enter food chain: Photosynthesis (carbon fixation).
Return to abiotic: Respiration and combustion.
Human impact: Burning fossil fuels increases atmospheric CO2; deforestation reduces photosynthesis.
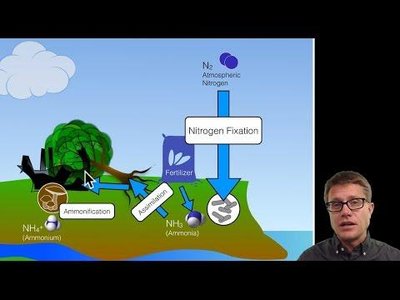
Nitrogen Cycle
Abiotic reservoir: N2 in the atmosphere.
Enter food chain: Nitrogen fixation by bacteria.
Recycle: Decomposition and nitrifying bacteria.
Return to abiotic: Denitrifying bacteria.
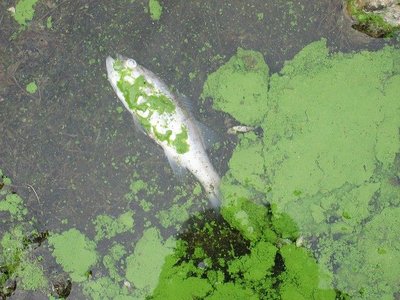
Human impact: Fertilizer runoff causes eutrophication; pesticides can kill soil bacteria.
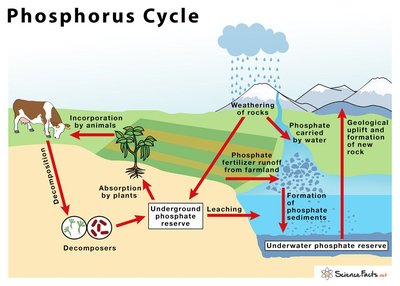
Phosphorus Cycle
Abiotic reservoir: Rocks, minerals, and soil.
Enter food chain: Erosion releases phosphate for plant uptake.
Recycle: Decomposers return phosphorus to soil.
Return to abiotic: Loss to ocean sediment.
Human impact: Fertilizer runoff causes eutrophication.
Water Cycle
Abiotic reservoir: Surface and atmospheric water.
Enter food chain: Precipitation and plant uptake.
Recycle: Transpiration by plants.
Return to abiotic: Evaporation and runoff.
Human impact: Pollution and deforestation reduce transpiration.
Population Ecology
Population Characteristics
A population is a group of organisms of the same species living in the same area. Populations are characterized by their range, density, and size.
Range: Geographic area occupied.
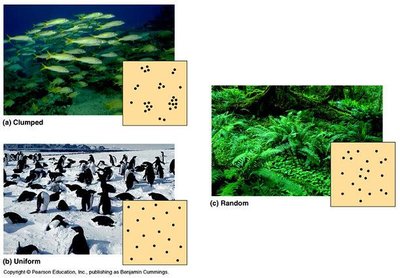
Dispersal & density: Clumped (most common), random, or uniform (territoriality).
Size: Increases through births and immigration; decreases through deaths and emigration.
Population Growth
Population growth rate is influenced by sex ratio, generation time, and age structure.
Sex ratio: Proportion of males to females.
Generation time: Age at which females reproduce.
Age structure: Number of females at reproductive age.
Survivorship Curves and Reproductive Strategies
Type I: High survival early, high mortality late (e.g., humans).
Type II: Constant mortality rate (e.g., birds).
Type III: High early mortality, survivors live long (e.g., many fish, plants).
K-selected species: Few offspring, high parental care, Type I curve.
r-selected species: Many offspring, little care, Type III curve.
Population Growth Models
Exponential growth: Occurs when resources are unlimited; population grows rapidly.
Logistic growth: Occurs when resources are limited; population stabilizes at carrying capacity (K).
Limiting factors can be density-dependent (e.g., competition, predation) or density-independent (e.g., weather, natural disasters).
Invasive species can outcompete native species due to lack of natural predators, reducing biodiversity.
Community Ecology
Community Interactions
Symbiosis: Close association between two species.
Parasitism: One benefits, one is harmed.
Mutualism: Both benefit.
Commensalism: One benefits, other unaffected.
Competition: Two species compete for the same niche; can lead to competitive exclusion or niche partitioning.
Predation: Predators hunt and kill prey; drives natural selection.
Adaptations and Mimicry
Aposematic coloration: Warning coloration in prey.
Batesian mimicry: Harmless species mimics a harmful one.
Müllerian mimicry: Two or more harmful species resemble each other.
Biodiversity and Stability
Importance of Biodiversity
Greater biodiversity increases ecosystem stability, providing more food resources, habitats, and resilience to environmental changes.
Simpson’s Diversity Index
Simpson’s Diversity Index quantifies biodiversity based on species number and population size. The index ranges from 0 (no diversity) to 1 (maximum diversity).
Species | # in Community |
|---|---|
A | 325 |
B | 305 |
C | 370 |
Total | 1000 |
Formula:
Keystone Species
Keystone species exert a disproportionate effect on community structure, increasing diversity. Example: Beavers create ponds, providing habitats for many species.
Ecological Succession
Primary and Secondary Succession
Primary succession: Begins without soil; pioneer species (bacteria, lichens, moss) break down rock to form soil (e.g., after volcanic eruption).
Secondary succession: Occurs where soil remains after disturbance; pioneer species are grasses and flowers (e.g., after fire or flood).
Climax community: Stable, final stage of succession.
Biodiversity is greatest in intermediate stages before taller plants outcompete smaller ones.
