 Back
BackEcology: Principles, Energy Flow, Biodiversity, and Population Dynamics
Study Guide - Smart Notes
 Tailored notes based on your materials, expanded with key definitions, examples, and context.
Unit 8: Ecology
8.1: Ecology – Introduction and Key Concepts
Ecology is the scientific study of interactions among organisms and between organisms and their environment. These interactions shape the distribution and abundance of life on Earth and are fundamental to understanding biological systems at all scales.
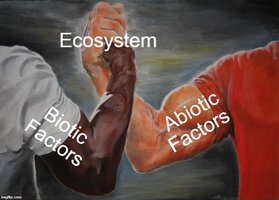
Biotic Factors: Living components of an ecosystem, including organisms and their remains.
Abiotic Factors: Non-living components such as temperature, water, sunlight, and minerals.
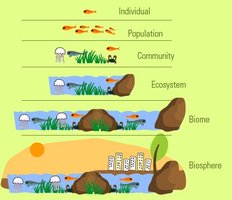
Levels of Ecological Organization:
Organism: An individual living thing.
Population: All individuals of a species in a specific area.
Community: Interacting populations in a shared environment.
Ecosystem: The community plus abiotic factors.
Biome: Large regions defined by climate and dominant life forms.
Biosphere: The global sum of all ecosystems and biomes.
8.1: Ecology – Trophic Roles
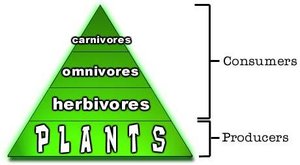
Organisms are classified by how they obtain energy and nutrients:
Producers (Autotrophs): Create their own food using solar (photosynthesis) or chemical energy (chemosynthesis).
Consumers (Heterotrophs): Obtain energy by eating other organisms.
Herbivores: Eat only plants.
Carnivores: Eat only animals.
Omnivores: Eat both plants and animals.
Decomposers: Break down dead organic matter, recycling nutrients.
8.2: Energy Flow in Ecosystems
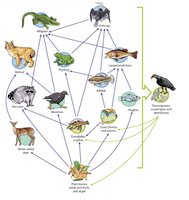
Food Chains and Food Webs
Energy flows through ecosystems in food chains and food webs, starting with producers and moving through various consumer levels.
Food Chain: Linear sequence of energy transfer.
Food Web: Complex network of interconnected food chains.
Trophic Levels: Positions in the food chain (producers, primary consumers, secondary consumers, etc.).
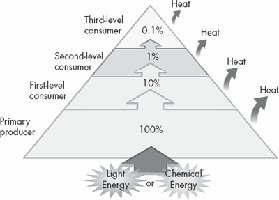
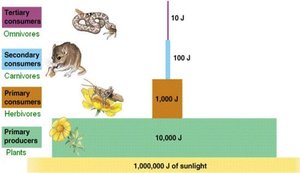
Energy Transfer and the 10% Rule
Only about 10% of the energy at one trophic level is transferred to the next; the rest is lost as heat. This limits the number of trophic levels in an ecosystem.
Primary Producers: Support all other trophic levels (e.g., plants, algae).
Primary Consumers: Herbivores that eat producers.
Secondary/Tertiary Consumers: Carnivores and omnivores that eat other consumers.
Decomposers/Detritivores: Obtain energy from dead organic material.
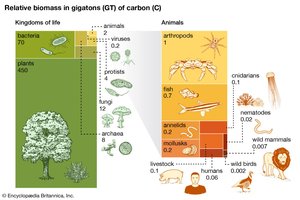
Biomass and Productivity
Biomass is the total dry mass of organisms in a given area and decreases at higher trophic levels due to energy loss.
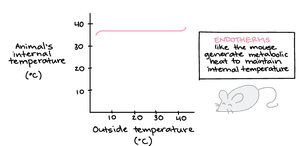
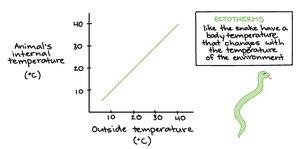
Thermoregulation
Organisms regulate body temperature in different ways:
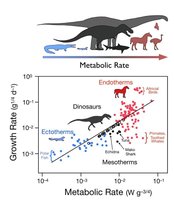
Endotherms: Maintain internal temperature using metabolic heat (e.g., mammals, birds).
Ectotherms: Rely on external sources for body heat (e.g., reptiles, amphibians).
Mesotherms: Intermediate strategy, seen in some extinct and extant species.
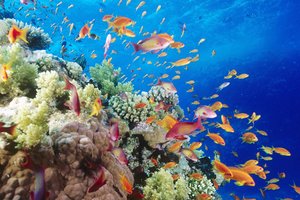
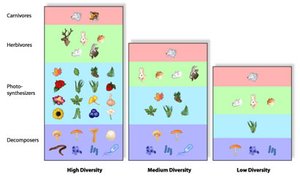
8.3: Biodiversity
Definition and Importance
Biodiversity refers to the variety of species within an ecosystem. High biodiversity increases ecosystem stability and biomass.
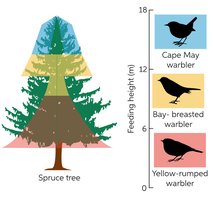
Ecological Niche: The role a species plays in its environment, including its diet, habitat, and interactions.
8.4: Population Dynamics
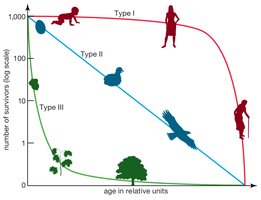
Survivorship Curves
Survivorship curves graph the number of individuals surviving at each age for a species:
Type I: Low mortality in early/mid life, high in old age (e.g., humans).
Type II: Constant mortality rate (e.g., rodents, reptiles).
Type III: High mortality in young, survivors live long (e.g., many fish, plants).

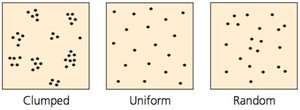
Population Dispersion Patterns
Clumped: Most common; individuals aggregate near resources.
Uniform: Evenly spaced, often due to territoriality.
Random: Unpredictable spacing, rare in nature.
Population Regulation
Density-Dependent Factors: Effects increase with population density (e.g., competition, predation, disease).
Density-Independent Factors: Affect populations regardless of density (e.g., weather, natural disasters).
8.5: Responses to Environment
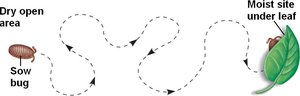
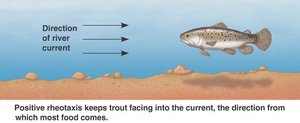
Behavioral Responses
Taxis: Directed movement toward or away from a stimulus (positive or negative taxis).
Kinesis: Random movement; change in activity rate in response to a stimulus.
Communication
Organisms communicate using auditory, tactile, chemical, or visual signals to exchange information, establish dominance, mark territory, find food, or attract mates.
8.6: Community Ecology
Species Interactions
Symbiosis: Close interaction between species (can be positive, negative, or neutral).
Competition (-/-): Both species are harmed by shared resource use.
Competitive Exclusion Principle: One species outcompetes another for the same niche.
Predation (+/-): One organism kills and eats another.
Prey Defenses: Warning coloration, camouflage, Batesian mimicry (harmless mimics harmful), Mullerian mimicry (harmful species resemble each other).
Parasitism (+/-): Parasite benefits, host is harmed.
Mutualism (+/+): Both species benefit.
Commensalism (+/0): One benefits, the other is unaffected.
Keystone and Invasive Species
Keystone Species: Not abundant but have a major impact on community structure.
Invasive Species: Non-native species that disrupt ecosystems.
8.7: Energy Flow – Primary Production
Gross and Net Primary Production
Gross Primary Production (GPP): Total energy captured by producers.
Net Primary Production (NPP): GPP minus energy used for producer respiration (R).
Formula:
Ecological Efficiency
Ecological efficiency is the percentage of energy transferred from one trophic level to the next.
Formula:
8.8: Biodiversity – Simpson’s Diversity Index
Measuring Biodiversity
Simpson’s Diversity Index quantifies biodiversity in a community:
n: Number of individuals of a particular species
N: Total number of individuals of all species
D: Diversity Index (higher values indicate greater diversity)
High D = stable, diverse ecosystem; Low D = disturbed or managed ecosystem.
8.9: Population Dynamics – Growth Models
Exponential Growth
Population grows rapidly under ideal conditions (rare in nature).
Equation:
r: Intrinsic growth rate
N: Population size
Growth Rate:
Logistic Growth and Carrying Capacity
Population growth slows as it approaches carrying capacity (K), forming an S-shaped curve.
Equation:
K: Carrying capacity (maximum sustainable population)
8.10: r-Selected vs. K-Selected Species
Life History Strategies
r-Selected Species: Rapid growth, many small offspring, little parental care (e.g., insects, plants).
K-Selected Species: Stable populations, few large offspring, high parental care (e.g., humans, elephants).
Summary Table: r-Selected vs. K-Selected Species
Characteristic | r-Selected | K-Selected |
|---|---|---|
Growth Rate | High | Low |
Offspring Number | Many | Few |
Parental Care | Low | High |
Size of Offspring | Small | Large |
Population Stability | Variable | Stable |
Key Equations
Exponential Growth:
Logistic Growth:
Net Primary Production:
Simpson’s Diversity Index:
