 Back
Environmental Variation, Species Distribution, and Animal Physiology
Study Guide - Smart Notes
 Tailored notes based on your materials, expanded with key definitions, examples, and context.
Environmental Variation and Species Distribution
The Ecological Niche
The concept of the ecological niche describes the range of environmental conditions and resources within which a species can survive, grow, and reproduce. This niche can be defined by multiple environmental variables, such as temperature and pH, forming an 'n-dimensional hypervolume' (G. Evelyn Hutchinson).
Ecological niche: The set of environmental conditions under which a species can persist.
Environmental variables: Factors like temperature, moisture, and pH that influence species survival.
Scaling up: From individual niches to the overall range of a species.

Global Temperature Distribution and Species Range
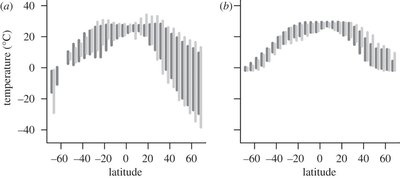
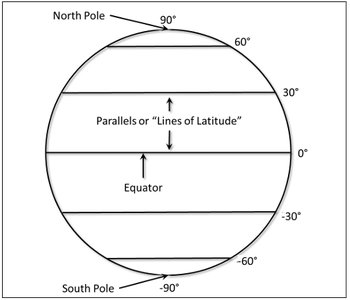
Temperature varies across latitudes, influencing where species can live. Understanding these patterns helps explain species distributions on a global scale.
Equator: The central latitude (0°) with the highest average temperatures.
Temperature patterns: Panel (a) shows greater temperature variability at higher latitudes, while panel (b) shows less variability.
Species range: Determined by tolerance to environmental conditions.
Occurrence Data and Mapping Species Distribution
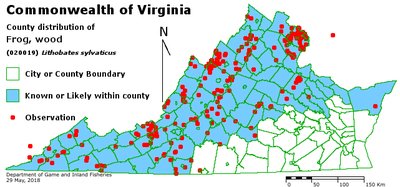
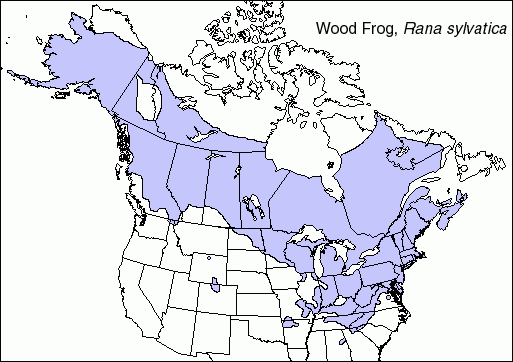
Occurrence data records where species have been observed. Mapping these data helps estimate species ranges, but different mapping methods have limitations.
Occurrence maps: Under-predict occupied area due to limited sampling.
County records: Over-predict occupied area by filling gaps beyond available data.
Habitat Suitability Models
Habitat suitability models use occurrence data and environmental variables to predict where species can live, even in unsurveyed areas. These models are species-specific and often constructed using Geographic Information Systems (GIS).
Habitat quality: Measured by environmental factors affecting survival.
GIS: Integrates spatial data for modeling habitat suitability.
Predictive power: Allows estimation of potential range beyond surveyed locations.
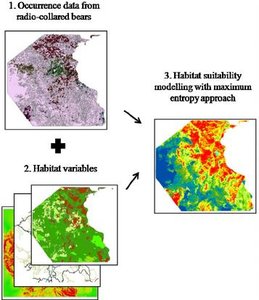
Factors Affecting Habitat Quality
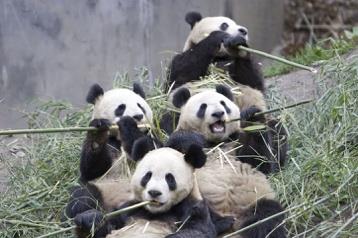
Multiple environmental factors impact habitat quality for species. For example, pandas are affected by elevation, vegetation type, bamboo availability, slope, aspect, and distance to drainage.
Single-factor suitability maps: Show how each factor influences habitat quality.
Combined models: Integrate all factors for comprehensive predictions.
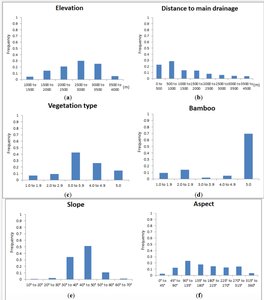
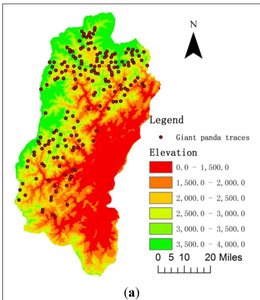
Species Interactions and Distribution
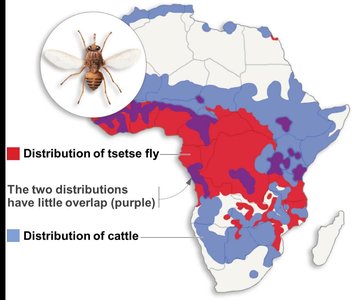
Biotic interactions, such as competition and disease, also shape species distributions. For example, tsetse flies limit cattle distribution in Africa due to disease transmission, and Argentine ants compete with native ants, but are limited by moisture.
Abiotic factors: Non-living environmental variables (e.g., soil moisture).
Biotic factors: Living interactions (e.g., competition, predation).
Human Health and Environmental Variation
Human genetic variation, such as sickle cell anemia, is influenced by environmental factors like the distribution of malaria mosquitoes. One copy of the sickle cell allele confers resistance to malaria, while two copies cause disease.
Genetic adaptation: Allele frequencies shaped by environmental pressures.
Disease distribution: Driven by habitat range of disease vectors.
Human Impact on Species Distribution
Humans alter species distributions by creating barriers, reducing habitat, and introducing species to new environments. Invasive species can thrive in suitable climates where they were previously absent.
Habitat modification: Construction, agriculture, and urbanization.
Species introduction: Movement of organisms to new regions.
Obtaining Occurrence Data
Occurrence data can be collected from databases and citizen science platforms like iNaturalist. These data are essential for mapping and modeling species distributions.
Data sources: Museum records, field surveys, online platforms.
Applications: Conservation, research, and management.
Evolution by Natural Selection and Species Distribution
Conditions for Natural Selection
Species distributions are shaped by natural selection, which requires variation, differential survival/reproduction, non-random survival, and heritability.
Variation: Individuals differ in traits.
Differential success: Some individuals survive/reproduce better.
Non-random survival: Survival depends on traits.
Heritability: Traits passed from parents to offspring.
Habitat Selection and Survival
Habitat selection is a product of natural selection, with individuals choosing environments that maximize their fitness. Iconic species often occupy marginal habitats due to specialized adaptations.
Marginal habitats: Environments with extreme conditions.
Adaptations: Specialized traits for survival.
Water Availability and Plant/Animal Distribution
Water availability is a key factor in plant distribution, which in turn affects animal distribution. Plants may have specialized roots or adaptations for flooded or dry soils.
Flooded habitats: Swamps, wetlands.
Dry habitats: Deserts, sand dunes.
Animal distribution: Linked to plant presence and water availability.
Introduction to Animal Physiology
What Is an Animal?
Animals are eukaryotic, multicellular organisms that lack cell walls, possess an extensive extracellular matrix, are heterotrophic (obtain carbon from other organisms), and exhibit motility at some stage of their life cycle.
Multicellularity: Cells organized into tissues and organs.
Heterotrophy: Ingestion of food.
Motility: Movement under own power.
How Animals Use Energy
ATP is the fundamental energy currency in animals, used for cellular respiration and building biomass. Energy allocation involves trade-offs, such as between growth and activity.
ATP: Adenosine triphosphate, main energy molecule.
Cellular respiration: Process converting fuel to ATP.
Energy allocation: Distribution of energy to different physiological functions.
Thermal Strategies in Animals
Animals regulate body temperature using different strategies: poikilothermy (variable temperature), homeothermy (constant temperature), and heterothermy (usually constant, with exceptions).
Poikilothermy: Body temperature fluctuates with environment (ectotherms).
Homeothermy: Body temperature remains constant (endotherms, stable environments).
Heterothermy: Usually constant, but can vary during periods like hibernation.
Measuring Metabolism
Metabolic rate (MR) quantifies energy metabolism in animals. It can be measured directly (calorimetry) or indirectly (oxygen consumption).
Direct calorimetry: Measures heat production.
Indirect respirometry: Measures O2 consumption as a proxy for metabolic rate.
Equation for glucose oxidation:
Metabolic rate: Energy metabolism per unit time.
Temperature and Metabolic Rate
Metabolic rate varies with environmental temperature and thermal strategy. Ectotherms' MR increases with temperature, while endotherms maintain a stable MR across a range of temperatures.
Basal metabolic rate: Minimum energy expenditure at rest.
Thermal strategy: Determines MR response to temperature.
Summary
Environmental variation underpins species distribution, with niches and natural selection shaping which species are found where. Animal physiology, including energy use and thermal strategies, is closely linked to environmental conditions.
