 Back
BackEnzyme Kinetics: Catalase Assay and Factors Affecting Enzyme Activity
Study Guide - Smart Notes
 Tailored notes based on your materials, expanded with key definitions, examples, and context.
Biological Catalysts: Enzyme Kinetics
Introduction to Enzymes
Enzymes are biological catalysts that accelerate chemical reactions in living cells by lowering the activation energy required for the reaction. Without enzymes, most biochemical reactions would occur too slowly to sustain life at physiological temperatures. For example, the oxidation of glucose is exergonic but requires enzymatic catalysis to proceed rapidly in cells.
Activation Energy: The minimum energy required to initiate a chemical reaction.
Exergonic Reaction: A reaction that releases energy, such as glucose oxidation.
Enzyme Example: Catalase decomposes hydrogen peroxide (H2O2) into water and oxygen.
Reaction catalyzed by catalase:
Peroxides are harmful by-products in cells, and catalase protects cellular structures by decomposing them.
Measuring Enzyme Activity: Catalase Assay
Enzyme activity is measured by the rate of substrate disappearance or product formation. In the catalase assay, the decomposition of hydrogen peroxide is monitored by collecting the oxygen gas produced.
Substrate: Hydrogen peroxide (H2O2)
Product: Oxygen gas (O2) and water (H2O)
Assay Principle: Oxygen gas displaces water in a graduated cylinder, allowing measurement of reaction rate.
Experimental Setup: The reaction flask contains substrate and buffer, and catalase is injected to start the reaction. Oxygen produced is measured by water displacement in a graduated cylinder.
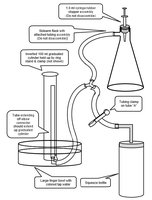
Figure: Glassware and tubing assembly used in enzyme assay. The setup includes a sidearm flask, tubing, graduated cylinder, and squeeze bottle for water adjustment.
Experimental Procedures
Prepare reaction flask with buffer and hydrogen peroxide.
Fill graduated cylinder with water and adjust meniscus.
Inject catalase solution to start reaction; oxygen produced displaces water.
Record water level at regular intervals to track oxygen production.
Calculate oxygen volume by subtracting initial air volume from each reading.
Data Analysis and Gas Law Calculations
To compare oxygen volumes under different conditions, convert measured volumes to standard temperature and pressure (STP) using the ideal gas law:
For conversion between experimental and STP conditions:
Rearrange to solve for :
Effect of Substrate Concentration
Increasing substrate concentration generally increases reaction rate due to more frequent enzyme-substrate collisions, up to a saturation point.
Prepare reaction flask with varying volumes of hydrogen peroxide and buffer.
Keep catalase volume constant.
Record oxygen production for each substrate concentration.
Run | Buffer (ml) | H2O2 (ml) | Catalase (ml) |
|---|---|---|---|
1 | 4.0 | 5.0 | 1.0 |
2 | 5.0 | 4.0 | 1.0 |
3 | 6.0 | 3.0 | 1.0 |
4 | 7.0 | 2.0 | 1.0 |
5 | 8.0 | 1.0 | 1.0 |
Graph: Plot reaction rate versus substrate concentration to observe saturation kinetics.
Effect of pH on Enzyme Activity
Enzyme activity is sensitive to pH, which affects protein conformation and the formation of enzyme-substrate complexes. Catalase activity is tested at pH values 11, 9, 7, 5, and 3.
Prepare reaction flask with constant substrate and varying buffer pH.
Record oxygen production for each pH.
Graph: Plot reaction rate versus pH to determine optimum pH for catalase.
Progress Curves and Reaction Rate Calculations
Progress curves show product formation (O2) over time. The initial slope represents the reaction rate:
For initial rate, use points where .
Initial rate decreases over time as substrate is depleted.
Curve flattens when substrate is exhausted.
Key Definitions
Active Site: Region of enzyme where substrate binds and reaction occurs.
Substrate: Molecule upon which an enzyme acts.
ES-Complex: Enzyme-substrate complex formed during catalysis.
Turnover Rate: Number of substrate molecules converted per enzyme per unit time.
Induced-Fit: Model where enzyme changes shape to accommodate substrate binding.
Discussion Points
Progress curves for substrate (H2O2) would show decreasing concentration over time, flattening as substrate is depleted.
Reaction rate decreases as substrate concentration drops.
Reaction rate vs. substrate concentration curve flattens at high concentrations due to enzyme saturation.
Optimum pH for catalase is near neutral; extreme pH denatures enzyme and reduces activity.
Enzyme activity increases with temperature (below optimum) due to increased molecular motion; drops above optimum due to denaturation.
Example: At pH 3, catalase activity is severely reduced, leaving much H2O2 unreacted. Raising pH may restore activity if enzyme is not irreversibly denatured.
Additional info: Enzyme kinetics are fundamental to understanding cellular metabolism and regulation. The catalase assay is a classic experiment for studying enzyme activity and environmental effects.
