 Back
BackExperimental Techniques to Analyze Cell Division and DNA Content in Eukaryotic Cells
Study Guide - Smart Notes
 Tailored notes based on your materials, expanded with key definitions, examples, and context.
Experimental Techniques to Analyze Cell Division and DNA Content in Eukaryotic Cells
Overview and Learning Outcomes
This guide summarizes key experimental methods used to study cell division and DNA content in eukaryotic cells. Understanding these techniques is essential for analyzing normal and abnormal cell proliferation, evaluating drug effects, and investigating genetic diseases. The notes cover microscopy-based and flow cytometry-based approaches, including qualitative and quantitative analyses, immunostaining, and live-cell imaging.
Microscopy-Based Methods
Types of Microscopy Used in Cell Division Analysis
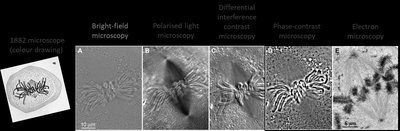
Microscopy is fundamental for visualizing cell division and identifying different phases of the cell cycle. Various microscopy techniques provide distinct advantages in resolution and contrast.
Brightfield Microscopy: Uses simple light to visualize cells; suitable for stained samples.
Polarized Light Microscopy: Enhances contrast in birefringent structures.
Differential Interference Contrast (DIC) Microscopy: Provides high-contrast images of unstained cells.
Phase-Contrast Microscopy: Highlights differences in refractive index within cells.
Electron Microscopy: Offers ultrastructural detail at high magnification.
Identification of Interphase vs. M Phase Cells
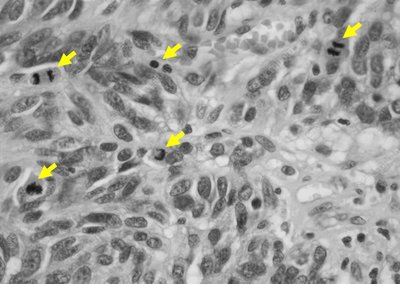
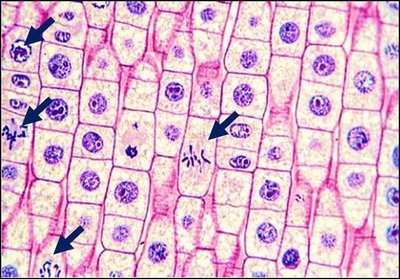
Microscopy enables both qualitative and quantitative assessment of cell cycle phases. Structural changes, such as chromosome condensation, are visible during mitosis.
Qualitative Analysis: Observes morphological changes in cells throughout the cell cycle.
Quantitative Analysis: Calculates the mitotic index, the percentage of cells in mitosis.
Fluorescence Microscopy and Fluorophores
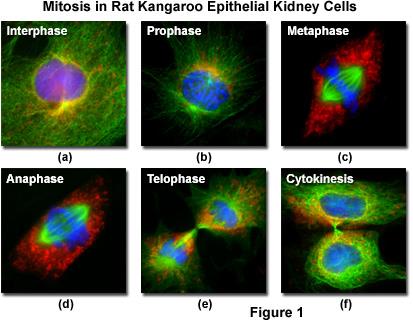
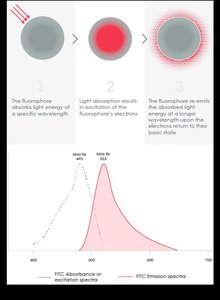
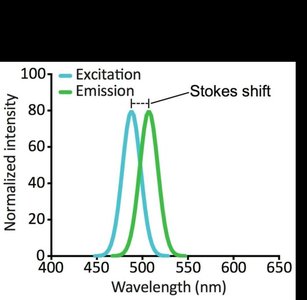
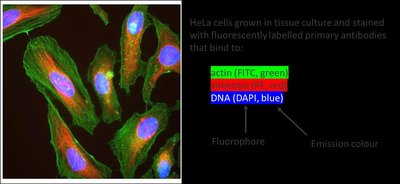
Fluorescence microscopy uses fluorophores to stain specific cellular structures, allowing detailed visualization of cell cycle events. Fluorophores absorb light at a specific wavelength and emit it at a longer wavelength (Stokes shift).
Fluorophores: Chemical compounds that absorb and emit light; used for staining DNA, proteins, and other cell components.
Common Fluorophores: DAPI (DNA), FITC (proteins), Propidium iodide (DNA).
Applications: Alone as dyes or conjugated to antibodies for immunostaining.
Principles of Fluorescence
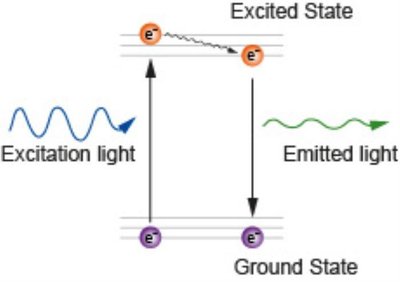
Fluorescence occurs when a fluorophore absorbs energy and emits it as light of a longer wavelength. The difference between excitation and emission wavelengths is the Stokes shift.
Excitation: Absorption of photons raises electrons to a higher energy state.
Emission: Electrons return to ground state, releasing energy as fluorescence.
Stokes Shift: The gap between excitation and emission wavelengths; larger shifts improve signal detection.
Immunofluorescence Techniques
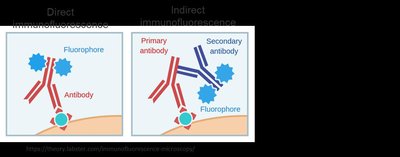
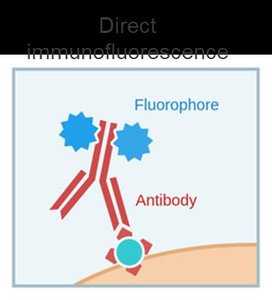
Immunofluorescence uses antibodies conjugated with fluorophores to detect specific proteins or antigens in cells. There are two main approaches:
Direct Immunofluorescence: Primary antibody is directly labeled with a fluorophore.
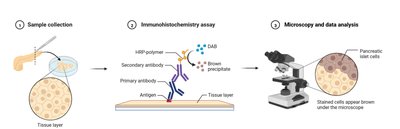
Indirect Immunofluorescence: Uses a non-fluorescent primary antibody and a fluorescently labeled secondary antibody.
Immunohistochemistry (IHC) and Cell Cycle Markers
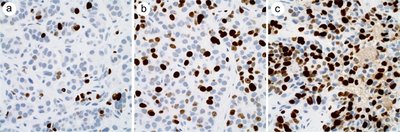
IHC and IF are used to stain for cell cycle-associated markers, such as Ki-67, which is expressed during active cell division. Ki-67 is a key biomarker in oncology for assessing tumor proliferation.
Ki-67: Expressed in S, G2, and M phases; absent in G0 and G1.
Clinical Relevance: High Ki-67 index indicates rapid tumor growth and can inform prognosis.
DNA Replication Analysis Using BrdU
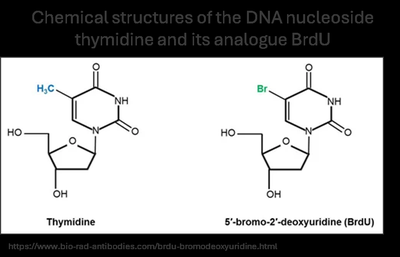
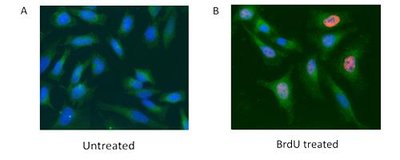
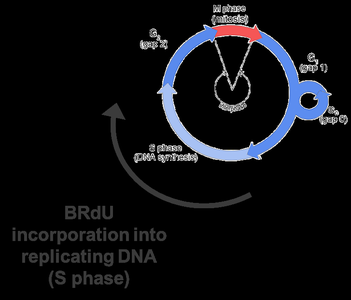
Bromodeoxyuridine (BrdU) is a thymidine analogue incorporated into newly synthesized DNA during S phase. BrdU labeling, followed by immunofluorescence, identifies replicating cells.
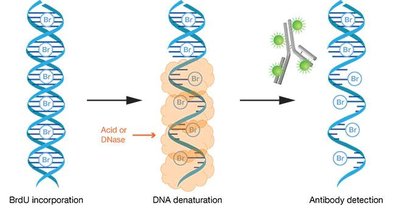
BrdU Incorporation: Cells are exposed to BrdU, which is incorporated into DNA during replication.
Detection: DNA is denatured, and BrdU is detected using specific antibodies.
Live Cell Imaging and Fluorescent Protein Tagging
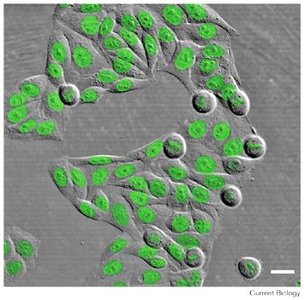
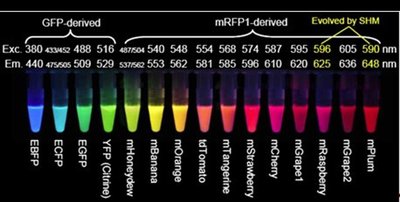
Genetic engineering allows tagging of proteins with fluorescent markers (e.g., GFP) for real-time imaging of cell cycle progression in living cells. GFP and its variants cover a wide range of colors and are used to visualize specific proteins or cell cycle stages.
Fusion Proteins: Genes encoding proteins of interest are fused with fluorescent protein genes.
Applications: Enables visualization of cell cycle dynamics and protein localization.

FUCCI Live Cell Cycle Reporter System
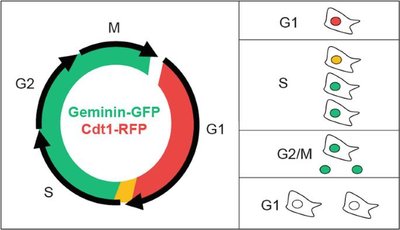
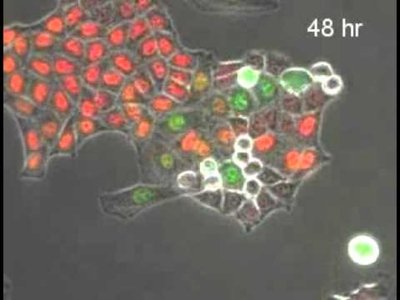
The FUCCI system uses genetically encoded fluorescent proteins to report cell cycle stages in living cells. Different colors indicate G1, S, and G2/M phases.
Geminin-GFP: Marks G2/M phase.
Cdt1-RFP: Marks G1 phase.
Applications: Real-time tracking of cell cycle progression.
Flow Cytometry-Based Methods
Principles of Flow Cytometry
Flow cytometry analyzes individual cells in suspension for various properties, including DNA content. Cells pass through lasers, and their fluorescence is measured, allowing rapid analysis of thousands of cells.
DNA Binding Dyes: DAPI, Hoechst, Propidium iodide, 7AAD.
Applications: Determines cell cycle phase, detects aneuploidy, and identifies dead/dying cells.
*Additional info: Flow cytometry is especially useful for large-scale quantitative analysis of cell populations, complementing microscopy-based methods.*
Summary Table: Comparison of Microscopy and Flow Cytometry Methods
Method | Principle | Applications | Advantages | Limitations |
|---|---|---|---|---|
Microscopy | Visualizes cell morphology and structure | Cell cycle phase identification, mitotic index, protein localization | High resolution, direct observation | Time-consuming, limited sample size |
Fluorescence Microscopy | Uses fluorophores to stain specific structures | Protein localization, DNA content, live-cell imaging | Specificity, multi-color labeling | Requires specialized equipment |
Flow Cytometry | Measures fluorescence in individual cells in suspension | DNA content analysis, cell cycle phase distribution | High throughput, quantitative | Less spatial information, requires cell suspension |
Recommended Reading and Resources
Scott, et al. (2022) Biological science biomedical edition: exploring the science of life. Oxford University Press. Chapter 10: Cell division in prokaryotes and eukaryotes
Alberts, et al. (2022) Molecular biology of the cell. W. W. Norton & Company. Chapter 17: The Cell Cycle
Khan Academy: Meiosis and Genetic Diversity topic
BioLibreTexts: Principles of Biology
