 Back
BackGene Evolution and Phylogenetic Inference in Biological Evolution
Study Guide - Smart Notes
 Tailored notes based on your materials, expanded with key definitions, examples, and context.
Gene Evolution and Phylogenetic Inference
Introduction
This study guide explores how the history of genes informs our understanding of evolution, focusing on gene trees, phylogenetic relationships, models of nucleotide substitution, and genome evolution. These concepts are central to understanding the evolutionary history of life and are directly relevant to the chapters on Evolution, Phylogeny, DNA Synthesis, and Genomics.
Gene Trees and Species Trees
Gene Trees vs. Species Trees
Gene trees represent the evolutionary relationships among gene copies, while species trees depict the evolutionary relationships among species. These trees may not always match due to processes such as incomplete lineage sorting.
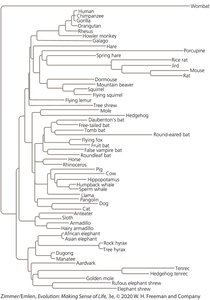
Gene Tree: A diagram showing the inferred evolutionary relationships among various gene copies found in different species.
Species Tree: A diagram showing the evolutionary relationships among a set of species.
Incomplete Lineage Sorting: Occurs when the genealogy of a gene does not match the species tree due to ancestral polymorphism persisting through speciation events.
Example: The BRCA1 gene tree may not perfectly match the phylogenetic relationships among mammals, illustrating the complexity of gene evolution.
Gene Tree and Species Tree Concordance
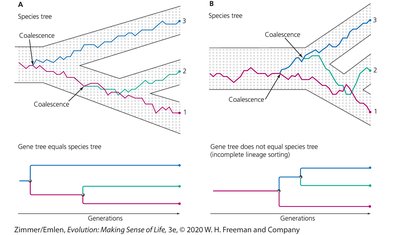
Gene trees can either match or differ from species trees. This is illustrated by coalescence events, which trace the ancestry of gene copies back through time.
Coalescence: The process by which the genealogy of gene copies merges as we trace their ancestry backward in time.
When gene trees equal species trees, the gene history mirrors the species history.
When gene trees do not equal species trees, it is often due to incomplete lineage sorting.
Models of Nucleotide Substitution
The Hasegawa Model of Nucleotide Transition
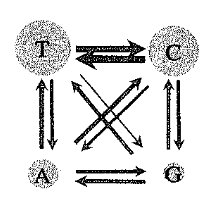
Understanding how nucleotides change over time is crucial for reconstructing evolutionary trees. The Hasegawa model describes the probabilities of transitions (purine to purine or pyrimidine to pyrimidine) and transversions (purine to pyrimidine or vice versa).
Transition: Substitution between two purines (A <-> G) or two pyrimidines (C <-> T).
Transversion: Substitution between a purine and a pyrimidine (A or G <-> C or T).
The Hasegawa model accounts for different rates of transitions and transversions.
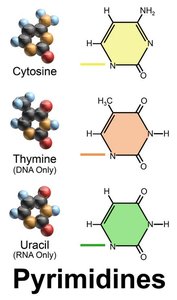
Purines and Pyrimidines
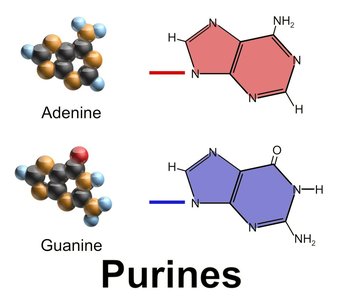
Nucleotides are classified as purines or pyrimidines, which is important for understanding mutation patterns in DNA.
Purines: Adenine (A) and Guanine (G)
Pyrimidines: Cytosine (C), Thymine (T, DNA only), and Uracil (U, RNA only)
Transitions are more common than transversions due to chemical similarity.
Modern Phylogenetic Tree Reconstruction
Maximum Likelihood and Bayesian Inference
Modern methods for reconstructing evolutionary trees use statistical models to account for nucleotide transition probabilities, providing more accurate phylogenies than simple parsimony methods.
Maximum Likelihood: Estimates the tree that is most likely to have produced the observed genetic data, given a model of evolution.
Bayesian Inference: Uses probability distributions to estimate the most probable tree, incorporating prior information and observed data.
These methods allow for more robust and realistic evolutionary hypotheses.
Applications of Evolutionary Trees
Biological and Clinical Insights
Evolutionary trees have provided significant insights into both biology and medicine, such as tracing the origins of diseases and understanding genome evolution.
Phylogenetic analysis can reveal the evolutionary history of pathogens, aiding in disease control and prevention.
Comparative genomics helps identify conserved and divergent genetic elements across species.
Genome Evolution
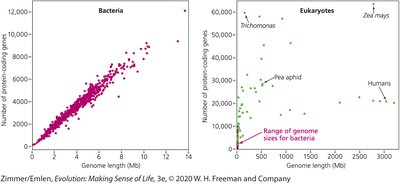
Differences in Genome Structure: Bacteria vs. Eukaryotes
Genome evolution varies significantly between bacteria and eukaryotes, particularly in the proportion of non-coding DNA.
Bacteria: Genomes are compact, with most DNA coding for proteins.
Eukaryotes: Tend to accumulate more non-coding sequences, leading to larger and more complex genomes.
The number of protein-coding genes does not always scale with genome size in eukaryotes.
Feature | Bacteria | Eukaryotes |
|---|---|---|
Genome Size | Small (few Mb) | Large (up to several Gb) |
Non-coding DNA | Low | High |
Gene Density | High | Low |
Summary
Understanding gene evolution, phylogenetic inference, and genome structure is essential for interpreting the evolutionary history of life. These concepts are foundational for advanced studies in evolution, genomics, and molecular biology.
