Back
General Biology Exam 1 Review: The Science of Life, Levels of Organization, and Data Visualization
Study Guide - Smart Notes
 Tailored notes based on your materials, expanded with key definitions, examples, and context.
The Scientific Method
Steps and Application
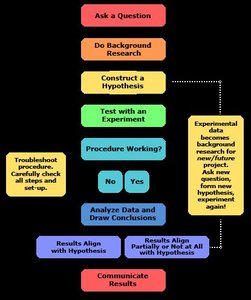
The scientific method is a systematic approach used by scientists to investigate natural phenomena, generate reliable data, and draw conclusions. It ensures objectivity and repeatability in scientific research.
Ask a Question: Identify a problem or phenomenon to investigate.
Do Background Research: Gather existing information relevant to the question.
Construct a Hypothesis: Formulate a tentative explanation or prediction that can be tested.
Test with an Experiment: Design and conduct experiments to test the hypothesis.
Procedure Working? Evaluate if the experiment is functioning as intended. If not, troubleshoot and adjust the procedure.
Analyze Data and Draw Conclusions: Compare results to the hypothesis and determine if the data supports or refutes it.
Communicate Results: Share findings with the scientific community.
Experimental data can inform future research, leading to new hypotheses and investigations.
Data Visualization in Biology
Types of Graphs and Their Uses
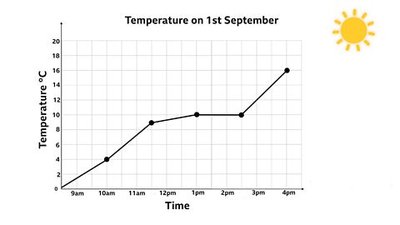
Biologists use various types of graphs to summarize, compare, and visualize experimental data. Each graph type serves a specific purpose:
Line Graphs: Display continuous changes over time, such as temperature fluctuations.
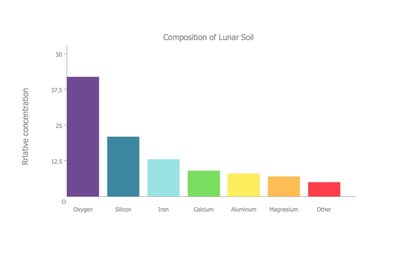
Bar Graphs: Compare categories or groups, such as concentrations of elements.
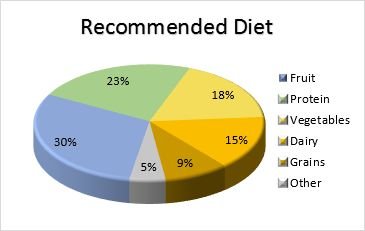
Pie Charts: Show proportions or percentages of a whole, such as dietary recommendations.
Example: A line graph can be used to track temperature changes throughout the day, while a bar graph can compare the composition of lunar soil, and a pie chart can illustrate the recommended proportions of food groups in a diet.
Levels of Organization in Biology
Hierarchy from Atoms to Biosphere
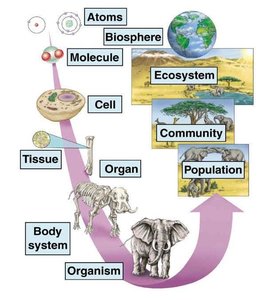
Biological systems are organized into a hierarchy, from the smallest units of matter to the largest ecological systems. Understanding these levels is fundamental to studying life.
Atom: The smallest unit of matter, composed of protons, neutrons, and electrons.
Molecule: A group of atoms bonded together, forming chemical compounds.
Organelle: Specialized structures within cells that perform distinct functions.
Cell: The fundamental unit of life; can be unicellular or multicellular.
Tissue: Groups of similar cells working together to perform a specific function.
Organ: Structures composed of multiple tissues that carry out particular tasks.
Organ System: Groups of organs working together to perform vital body functions.
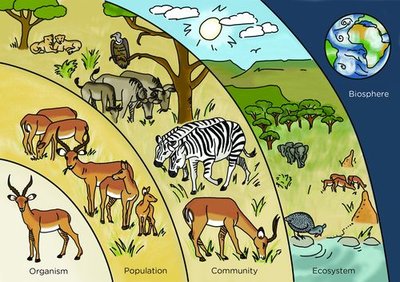
Organism: An individual living being.
Population: A group of individuals of the same species living in a specific area.
Community: All interacting populations in an ecosystem.
Ecosystem: All living organisms in an area plus the nonliving components affecting them.
Biosphere: All life on Earth and the environments that support it.
Example: The human body is composed of cells, which form tissues, organs, and organ systems, ultimately making up the organism. Organisms interact within populations, communities, ecosystems, and the biosphere.