 Back
General Biology Study Guidance: Cell Structure, Membrane Transport, and Osmosis
Study Guide - Smart Notes
 Tailored notes based on your materials, expanded with key definitions, examples, and context.
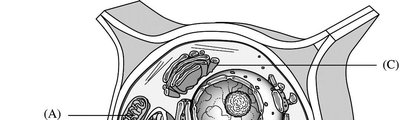
Q1. Identify the labeled structures (A–E) in the plant cell diagram and describe their primary functions.
Background
Topic: Eukaryotic Cell Structure (Plant Cell)
This question tests your knowledge of plant cell anatomy and the functions of major organelles. Understanding the structure and function of each labeled part is fundamental in cell biology.
Key Terms and Concepts:
Cell Wall: Provides structural support and protection.
Chloroplast: Site of photosynthesis.
Nucleus: Contains genetic material and controls cell activities.
Vacuole: Stores water, nutrients, and waste products.
Mitochondrion: Site of cellular respiration and energy production.
Step-by-Step Guidance
Examine the diagram and locate each labeled structure (A–E). Use the shape, position, and context within the cell to help identify each organelle.
Recall the unique features of plant cells, such as the presence of a cell wall, large central vacuole, and chloroplasts.
Match each label to the correct organelle by considering its appearance and location (e.g., the large central structure is likely the vacuole, the thick outermost layer is the cell wall).
For each identified structure, briefly describe its main function in the plant cell.
Review your answers and ensure you have matched each label to the correct organelle and function, but do not write the final list yet.
Try solving on your own before revealing the answer!
Final Answer:
(A) Mitochondrion: Site of cellular respiration, produces ATP.
(B) Chloroplast: Site of photosynthesis, converts solar energy to chemical energy.
(C) Nucleus: Contains DNA, controls cell activities.
(D) Central Vacuole: Stores water, maintains turgor pressure.
(E) Cell Wall: Provides structural support and protection.
Each structure plays a critical role in plant cell function and survival.
Q2. Examine the dialysis tube experiment data. What does the change in mass of the tubes indicate about the movement of water and sucrose?
Background
Topic: Osmosis and Diffusion
This question tests your understanding of osmosis, the movement of water across a semipermeable membrane, and how solute concentration affects water movement.
Key Terms and Concepts:
Osmosis: Diffusion of water across a semipermeable membrane from low to high solute concentration.
Hypertonic: Solution with higher solute concentration compared to another.
Hypotonic: Solution with lower solute concentration compared to another.
Isotonic: Solutions with equal solute concentrations.
Step-by-Step Guidance
Review the table and note the initial and final masses for each dialysis tube.
Compare the contents of the tube and the beaker for each setup (e.g., 5% sucrose in tube vs. distilled water in beaker).
Determine whether water would move into or out of the tube based on the relative concentrations (osmosis direction).
Observe the trend in mass change over time for each tube and relate it to the movement of water.
Consider what would happen to the mass if the solution inside the tube is hypertonic, hypotonic, or isotonic relative to the beaker, but do not state the final interpretation yet.
Try solving on your own before revealing the answer!
Final Answer:
The change in mass indicates the direction of water movement by osmosis:
Tubes with sucrose in distilled water (tubes 1–4) gained mass, showing water entered the tube (solution inside was hypertonic).
The tube with distilled water in distilled water (tube 5) showed no change, indicating isotonic conditions.
The tube with distilled water in 40% sucrose (tube 6) lost mass, showing water left the tube (solution outside was hypertonic).
This demonstrates osmosis: water moves from areas of low solute concentration to high solute concentration across a semipermeable membrane.
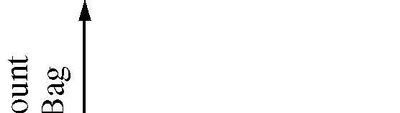
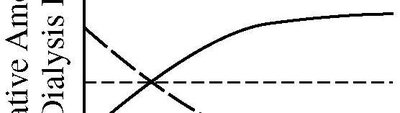
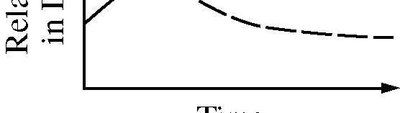
Q3. Interpret the graphs showing the relative amount of substance in a dialysis bag over time. What do these graphs reveal about diffusion and equilibrium?
Background
Topic: Diffusion and Equilibrium
This question tests your ability to interpret graphical data related to the movement of molecules across a semipermeable membrane and the concept of dynamic equilibrium.
Key Terms and Concepts:
Diffusion: Movement of molecules from high to low concentration.
Semipermeable Membrane: Allows certain molecules to pass while blocking others.
Equilibrium: State where concentrations are equal on both sides of the membrane.
Step-by-Step Guidance
Examine each graph and identify the trends in the relative amount of substance inside and outside the dialysis bag over time.
Note the starting concentrations and how they change as time progresses.
Observe where the lines level off, indicating no further net movement of molecules.
Relate these trends to the process of diffusion and the establishment of equilibrium.
Think about what the graphs suggest about the permeability of the membrane to different substances, but do not state the final conclusion yet.
Try solving on your own before revealing the answer!
Final Answer:
The graphs show that over time, the relative amount of substance inside and outside the dialysis bag approaches equilibrium. The lines leveling off indicate that diffusion has occurred until the concentrations are equal, demonstrating the principle of dynamic equilibrium across a semipermeable membrane.
Q4. Based on the diagram of the semipermeable membrane and the labeled chambers, predict the direction of water movement and explain your reasoning.
Background
Topic: Osmosis and Membrane Transport
This question tests your understanding of how water moves across a semipermeable membrane in response to solute concentration differences.
Key Terms and Concepts:
Semipermeable Membrane: Allows water to pass but not solute.
Osmosis: Water moves from low to high solute concentration.
Concentration Gradient: Difference in solute concentration across a membrane.
Step-by-Step Guidance
Identify the solute concentrations in each chamber (A and B) and the direction water can move.
Recall that water moves toward the side with higher solute concentration (lower water potential).
Consider the role of the semipermeable membrane in restricting solute movement but allowing water to pass.
Predict which chamber will gain water and which will lose water based on the concentration gradient.
Set up your reasoning for the direction of water movement, but do not state the final answer yet.
Try solving on your own before revealing the answer!
Final Answer:
Water will move from the chamber with lower solute concentration (higher water potential) to the chamber with higher solute concentration (lower water potential). This is due to osmosis, as water moves to balance the solute concentrations on both sides of the semipermeable membrane.
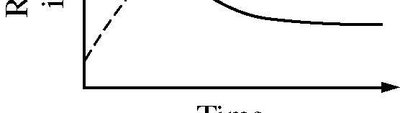
Q5. Analyze the graph showing the rate of contractile vacuole contractions versus osmolarity. What does this tell you about the cell's response to osmotic stress?
Background
Topic: Osmoregulation in Protists
This question tests your understanding of how single-celled organisms like protists use contractile vacuoles to maintain osmotic balance in different environments.
Key Terms and Concepts:
Contractile Vacuole: Organelle that expels excess water from the cell.
Osmolarity: Concentration of solute particles in a solution.
Osmoregulation: Regulation of water and solute balance.
Step-by-Step Guidance
Examine the graph and note how the rate of contractile vacuole contractions changes as osmolarity increases.
Recall that in hypotonic environments (low osmolarity), water enters the cell, increasing the need for the contractile vacuole to expel water.
As osmolarity increases (environment becomes less hypotonic or more hypertonic), less water enters the cell.
Relate the trend in the graph to the cell's need to regulate internal water balance.
Prepare to explain the relationship, but do not state the final answer yet.
Try solving on your own before revealing the answer!
Final Answer:
The graph shows that as osmolarity increases, the rate of contractile vacuole contractions decreases. This indicates that in more dilute (hypotonic) environments, the cell must expel more water to maintain osmotic balance, while in more concentrated (hypertonic) environments, less water enters the cell, so fewer contractions are needed.
