 Back
BackGenes and Chromosomes: Mendelian and Non-Mendelian Genetics
Study Guide - Smart Notes
 Tailored notes based on your materials, expanded with key definitions, examples, and context.
Genetics: The Study of Heredity
Introduction to Genetics
Genetics is the branch of biology that focuses on heredity, the process by which traits are passed from parents to offspring. The field explores how genetic information is transmitted, expressed, and varied among individuals and populations.
Heredity: The transmission of traits from one generation to the next.
Trait: Any observable characteristic of an organism, such as flower color or eye shape.
Key Terminology in Genetics
Essential Genetic Terms
Understanding genetics requires familiarity with several foundational terms:
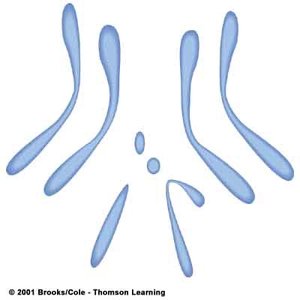
Homologous Chromosomes: Chromosome pairs, one from each parent, that are similar in shape, size, and genetic content.
Gene: A segment of DNA that encodes information for a specific trait.
Allele: Different versions of a gene found at the same locus on homologous chromosomes.
Locus (plural: loci): The specific physical location of a gene on a chromosome.
Dominant Allele: An allele that masks the expression of another allele at the same locus.
Recessive Allele: An allele whose expression is masked by a dominant allele.
Homozygous: Having two identical alleles for a gene (e.g., AA or aa).
Heterozygous: Having two different alleles for a gene (e.g., Aa).
True Breeding: Organisms that, when self-fertilized, produce offspring identical to themselves for a trait.
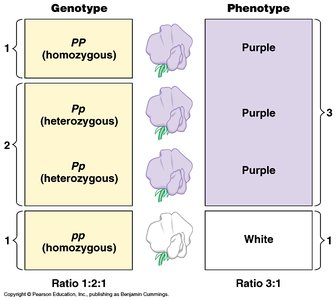
Genotype: The genetic constitution of an individual (e.g., PP, Pp, or pp).
Phenotype: The observable traits resulting from the genotype (e.g., purple or white flowers).

Mendelian Genetics
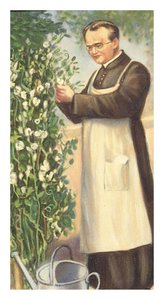
Gregor Mendel and the Pea Plant Experiments
Gregor Mendel, known as the Father of Genetics, used the scientific method to study the inheritance of traits in pea plants (Pisum sativum). His experiments laid the foundation for classical genetics.
Model Organism: Pea plants were chosen for their easily observable traits and controlled breeding.
Blending Hypothesis: The idea that offspring are a 'blend' of parental traits, which Mendel disproved.

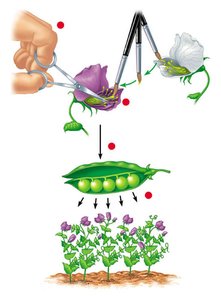
Mendel's Experimental Method
Mendel performed controlled crosses between pea plants with different traits, such as flower color. He removed stamens from one flower and transferred pollen from another to ensure controlled fertilization.
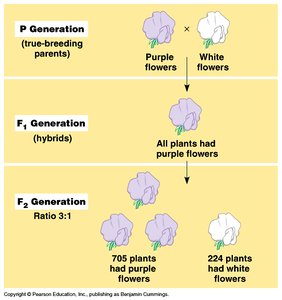
P Generation: True-breeding parents (e.g., purple x white flowers).
F1 Generation: First filial generation; all offspring showed the dominant trait (purple flowers).
F2 Generation: Second filial generation; traits segregated in a 3:1 ratio (purple:white).
Mendel's Conclusions
Law of Segregation: Each individual has two alleles for each gene, which segregate during gamete formation so that each gamete carries only one allele.
Dominance: In heterozygotes, the dominant allele is expressed, while the recessive allele is masked.

Punnett Squares and Probability
Monohybrid and Dihybrid Crosses
Punnett squares are tools used to predict the genotypic and phenotypic ratios of offspring from genetic crosses.
Monohybrid Cross: Examines inheritance of a single trait (e.g., Aa x Aa).
Genotypic Ratio: 1:2:1 (AA:Aa:aa) for heterozygote crosses.
Phenotypic Ratio: 3:1 (dominant:recessive) for heterozygote crosses.
Dihybrid Cross: Examines inheritance of two traits (e.g., RrYy x RrYy).
Law of Independent Assortment
Genes for different traits assort independently of one another during gamete formation, provided they are on different chromosomes or far apart on the same chromosome.
Rule of Multiplication: The probability of two independent events occurring together is the product of their individual probabilities.
Non-Mendelian Inheritance
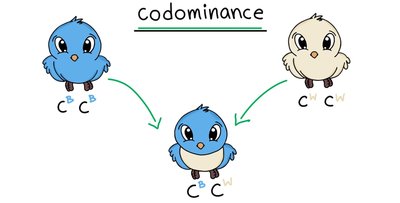
Codominance
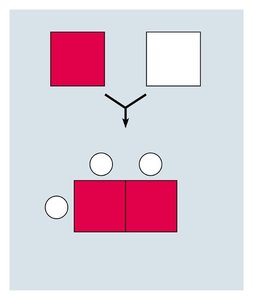
In codominance, both alleles are fully expressed in the heterozygote, resulting in a phenotype that shows both traits distinctly.
Example: In some birds, a cross between a blue-feathered and a white-feathered individual produces offspring with both blue and white feathers.
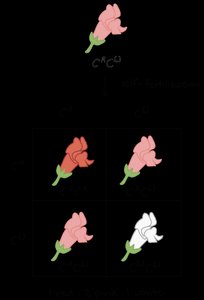
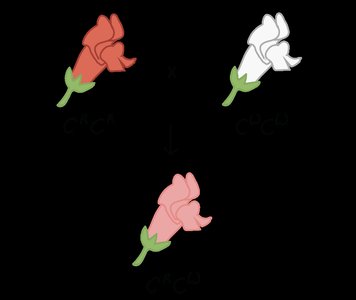
Incomplete Dominance
Incomplete dominance occurs when the heterozygote displays an intermediate phenotype between the two homozygotes.
Example: Crossing red and white snapdragons yields pink flowers in the F1 generation.
Epistasis
Epistasis is a form of gene interaction where one gene masks or modifies the expression of another gene at a different locus.
Example: Coat color in mice, where one gene determines pigment color and another gene determines pigment deposition.
Sex Linkage
Sex-linked traits are associated with genes located on sex chromosomes, most commonly the X chromosome. These traits often show unique inheritance patterns, especially in males who have only one X chromosome.
Example: Red-green color blindness and hemophilia in humans.
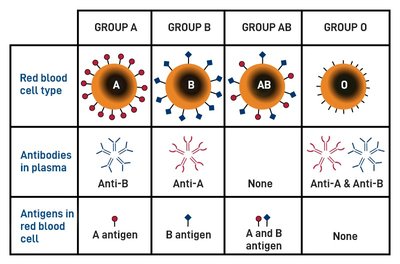
Multiple Alleles
Some genes have more than two allelic forms in the population, resulting in multiple possible phenotypes.
Example: The ABO blood group system in humans, which is determined by three alleles (IA, IB, i).
Gene Linkage and Mapping
Gene Linkage
Genes located close together on the same chromosome tend to be inherited together, a phenomenon known as linkage. The closer two genes are, the lower the probability of recombination between them.
Linkage Map: A diagram showing the relative positions of genes on a chromosome, measured in map units (1 map unit = 1% recombination frequency).
Pedigree Analysis
Family Pedigrees
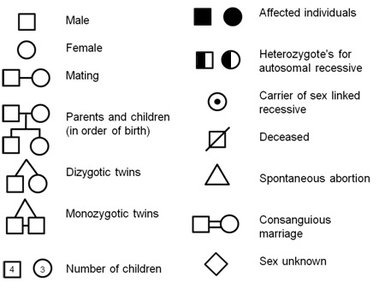
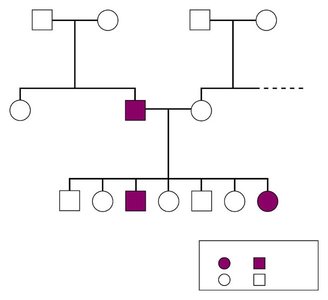
Pedigrees are diagrams that depict the inheritance of traits across generations in a family. They are used to analyze the mode of inheritance (dominant, recessive, sex-linked, etc.) of specific traits or disorders.
Symbols: Squares represent males, circles represent females, shaded symbols indicate affected individuals.
Applications: Used in genetic counseling and to predict the probability of inheriting genetic disorders.
Summary Table: Mendelian vs. Non-Mendelian Inheritance
Type | Definition | Example |
|---|---|---|
Mendelian (Simple Dominance) | One allele is dominant over the other | Purple vs. white flowers in peas |
Codominance | Both alleles are fully expressed | AB blood type |
Incomplete Dominance | Heterozygote shows intermediate phenotype | Pink snapdragons |
Epistasis | One gene masks/modifies another | Mouse coat color |
Sex Linkage | Gene located on sex chromosome | Red-green color blindness |
Multiple Alleles | More than two alleles in population | ABO blood group |
Key Equations
Probability of Independent Events:
Genotypic Ratio for Monohybrid Cross (Aa x Aa):
Phenotypic Ratio for Monohybrid Cross (Aa x Aa):
Map Unit Calculation:
Additional info: This guide expands on the provided notes with academic context, definitions, and examples to ensure completeness and clarity for exam preparation.
