 Back
BackHuman Population Ecology and Environmental Impact
Study Guide - Smart Notes
 Tailored notes based on your materials, expanded with key definitions, examples, and context.
Human Population
Current Status and Growth Trends
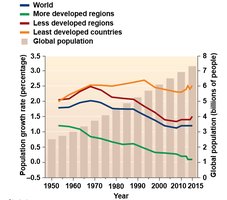
The human population has experienced rapid growth, especially since the 1800s. As of now, the global population exceeds 7.3 billion and is projected to surpass 9.7 billion by 2050. The current annual increase is about 88 million people, or nearly 3 per second. Although the growth rate is 1.2%, the large base population means the doubling time is relatively short, with a billion people added every 12 years.
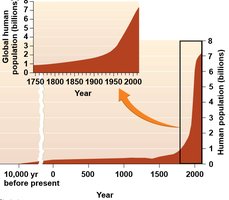
Industrial Revolution: Marked the beginning of rapid population growth due to advances in medical care, sanitation, agriculture, and overall living standards.
Decreased Infant Mortality: Improvements in health and nutrition have reduced infant mortality and increased lifespan.
Global Distribution and Growth Rates
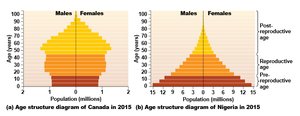
Population growth rates vary significantly by region. Some countries experience negative or slow growth, while others, particularly in Africa and parts of Asia, have high growth rates.
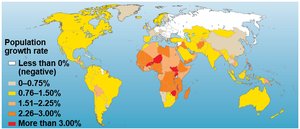
Regional Differences: Developed countries tend to have lower or negative growth rates, while developing countries often have higher rates.
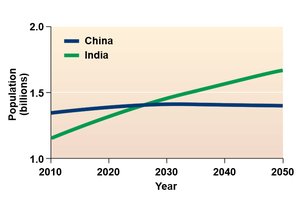
Future Projections: India is expected to surpass China as the most populous country by 2050.
Population Ecology Concepts
Population Size, Density, and Distribution
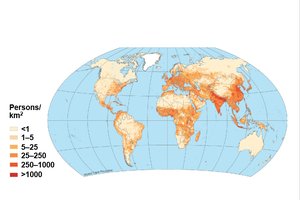
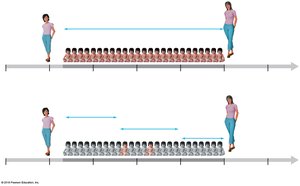
Population ecology applies ecological principles to human populations, examining variables such as size, density, and distribution. Human populations are not evenly spread; instead, they exhibit a clumped distribution, with high densities in urban and fertile regions.
Population Size: The total number of individuals in a population.
Population Density: Number of individuals per unit area; high densities can lead to resource competition and environmental stress.
Population Distribution: The spatial arrangement of individuals; humans are typically clumped due to social, economic, and environmental factors.
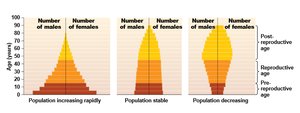
Age Structure
Age structure diagrams show the relative number of individuals in different age classes. These diagrams help predict future population trends:
If most individuals are young or of reproductive age, the population will likely grow.
If most are older, the population may decline.
An even distribution suggests a stable population.
Comparisons between countries illustrate these trends:
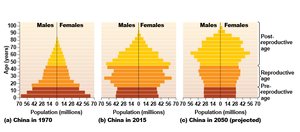
Sex Ratios
The natural sex ratio at birth is about 1.06 males per female. However, social policies and cultural preferences can distort this ratio, leading to demographic challenges.
Example: China's one-child policy resulted in a higher proportion of males, which can affect future population dynamics.
BIDE Model: Birth, Immigration, Death, Emigration
Population change is determined by four main factors: Births, Immigration, Deaths, and Emigration (BIDE). Recent trends include declining infant mortality, lower fertility rates, and significant migration in some regions.
Total Fertility Rate (TFR): The average number of children a woman has in her lifetime. Replacement fertility (for stable population) is about 2.1.
Region | Total Fertility Rate (TFR) |
|---|---|
Africa | 4.7 |
Australia and South Pacific | 2.5 |
Latin America and Caribbean | 2.1 |
Asia | 2.2 |
North America | 1.8 |
Europe | 1.4 |
Demographic Transition Model
Stages of Demographic Transition
The demographic transition model describes how economic and social development affects population growth:
Pre-industrial: High birth and death rates; population growth is slow.
Transitional: Death rates decline due to improved nutrition and healthcare; population grows rapidly.
Industrial: Birth rates decline as societies become more urbanized and educated; growth slows.
Post-industrial: Both birth and death rates are low; population stabilizes or declines.
Most of the world's population is in developing nations, many of which are in the transitional or industrial stages. If all nations adopted the consumption patterns of developed countries, Earth's resources would be insufficient to support everyone.
Societal Issues Affecting Population Growth
Family Planning and Reproductive Choices
Family planning, including contraception and natural family planning (NFP), helps slow population growth by allowing families to control the number and spacing of children. The use of contraception varies widely by country, and women's reproductive windows are influenced by social and economic factors.
Delaying Childbirth: Women may delay having children for education or career, reducing overall fertility.
Contraception: Increases control over family size and spacing of births.
Affluence, Resource Use, and Environmental Impact
Affluence increases per capita resource consumption, amplifying environmental impact. The richest 20% of the world uses 86% of resources, and the ecological footprint of developed nations far exceeds that of developing countries. Humanity may already be exceeding Earth's biocapacity by 50%.
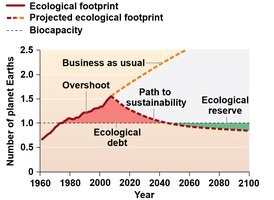
Ecological Footprint: A measure of human demand on Earth's ecosystems.
Biocapacity: The capacity of ecosystems to produce resources and absorb wastes.
Overshoot: When ecological footprint exceeds biocapacity, leading to resource depletion and environmental degradation.
Example: The addition of one American has the same environmental impact as adding 3.4 Chinese, 8 Indians, or 14 Afghans.
Summary Table: Key Demographic Factors
Factor | Definition | Impact on Population |
|---|---|---|
Population Size | Total number of individuals | Determines overall resource needs |
Population Density | Individuals per unit area | Influences competition and environmental stress |
Age Structure | Distribution by age group | Predicts growth or decline |
Sex Ratio | Ratio of males to females | Affects reproduction and social dynamics |
BIDE | Births, Immigration, Deaths, Emigration | Directly changes population size |
Key Equations
Population Growth Rate:
Doubling Time (Rule of 70):
Replacement Fertility Rate:
Additional info: These notes integrate core concepts from population ecology, demography, and environmental science, providing a comprehensive overview suitable for college-level biology students.
