 Back
BackInferring Phylogenies: Principles and Practice
Study Guide - Smart Notes
 Tailored notes based on your materials, expanded with key definitions, examples, and context.
Inferring Phylogenies
Introduction to Phylogenetic Trees
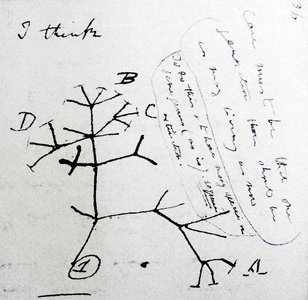
Phylogenetic trees are diagrams that represent the evolutionary relationships among various biological species based on similarities and differences in their physical or genetic characteristics. These trees help biologists understand how species are related through common ancestry and how traits have evolved over time.
Phylogeny: The evolutionary history and relationship among individuals or groups of organisms.
Phylogenetic tree: A branching diagram showing the inferred evolutionary relationships among species.
Node: Represents a common ancestor.
Branch: Represents the evolutionary lineage.
Tip: Represents a living or extinct species.
Root: The most recent common ancestor of all taxa in the tree.
Reading Phylogenetic Trees
Reading a phylogenetic tree involves interpreting the branching patterns to determine relationships among species. The position of nodes and branches indicates the order of divergence and relatedness.
Time is typically represented from the root (past) to the tips (present).
Species that share a more recent common ancestor are more closely related.
Rotating branches around nodes does not change the relationships depicted.

Mapping Traits on Phylogenetic Trees
Traits can be mapped onto phylogenetic trees to infer the origin and loss of characteristics. This process helps identify when specific traits evolved and which groups share them due to common ancestry.
Parsimony: The principle that the simplest explanation (fewest evolutionary changes) is preferred.
Traits are mapped by marking their appearance or loss on the branches of the tree.
Assume each novel trait arose only once and was never lost (ideal case).
Estimating Relationships Using Traits
By comparing the presence or absence of traits among species, we can estimate their evolutionary relationships. This is often done using a data matrix and applying parsimony to find the most likely tree.
Construct a character matrix with species as rows and traits as columns.
Score each trait as present (1) or absent (0).
Use the matrix to infer the most parsimonious tree.
Species | Jaws | Limbs | Amniotic egg | Fur & lactation | Scales with keratin |
|---|---|---|---|---|---|
Lizards | 1 | 1 | 1 | 0 | 1 |
Ray-finned fishes | 1 | 0 | 0 | 0 | 0 |
Mammals | 1 | 1 | 1 | 1 | 0 |
Lampreys | 0 | 0 | 0 | 0 | 0 |
Snakes | 1 | 0* | 1 | 0 | 1 |
Amphibians | 1 | 1 | 0 | 0 | 0 |
Additional info: The table above is inferred from the worksheet and is used to reconstruct evolutionary relationships using parsimony.
Monophyletic Groups and the "One Snip" Test
A monophyletic group (clade) includes an ancestor and all its descendants. Identifying monophyletic groups is essential for understanding evolutionary history.
The "one snip" test: If you can cut a branch of the tree with a single snip and include all members of a group, it is monophyletic.
Non-monophyletic groups either exclude some descendants (paraphyletic) or include species from different ancestors (polyphyletic).

Practice: Interpreting Phylogenies
Practice questions often involve determining which groups are more closely related, identifying monophyletic groups, and mapping traits on trees. For example:
Which group is more closely related to lampreys: ray-finned fishes or lizards?
Which group is more closely related to lizards: mammals or amphibians?
Circle three monophyletic groups on a given phylogeny.
Key Terms and Concepts
Synapomorphy: A shared, derived trait that is unique to a particular clade and inherited from a common ancestor.
Homoplasy: A trait shared by a set of species but not present in their common ancestor (often due to convergent evolution).
Outgroup: A species or group used as a reference point for determining the evolutionary relationships among the ingroup species.
Summary Table: Types of Groups in Phylogenetics
Group Type | Definition | Example |
|---|---|---|
Monophyletic | Ancestor and all descendants | Mammals |
Paraphyletic | Ancestor and some, but not all, descendants | Reptiles (excluding birds) |
Polyphyletic | Unrelated organisms from different ancestors | Marine mammals (whales, seals) |
Applications of Phylogenetic Analysis
Phylogenetic trees are used in various biological fields, including:
Understanding evolutionary history and speciation events
Classifying organisms based on evolutionary relationships
Tracing the origin and spread of traits or diseases
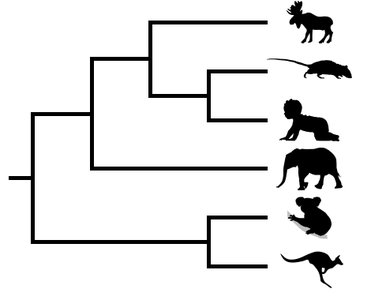
Example: Marsupial Phylogeny
Marsupials such as opossums, koalas, wombats, wallabies, and kangaroos can be analyzed using phylogenetic trees to determine the origin of traits like pouches, reduced tails, and large bodies. By mapping these traits, we can infer their evolutionary history and relationships.
Conclusion
Understanding how to read and interpret phylogenetic trees is fundamental to evolutionary biology. By applying principles such as parsimony and identifying monophyletic groups, students can reconstruct evolutionary histories and gain insights into the diversification of life.
