 Back
Inheritance, Sex Chromosomes, Linkage, and Hardy-Weinberg Equilibrium: Study Notes for General Biology
Study Guide - Smart Notes
 Tailored notes based on your materials, expanded with key definitions, examples, and context.
Inheritance and Evolution in Diploid Organisms
Chromosomal Theory of Inheritance
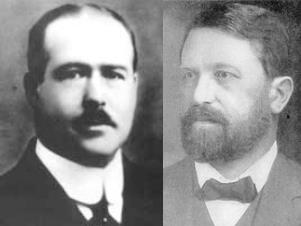
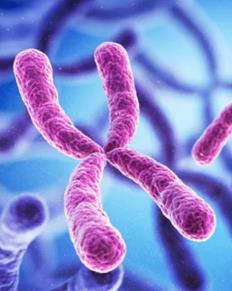
The Chromosomal Theory of Inheritance, developed by Walter Sutton and Theodor Boveri in the early 1900s, states that chromosomes carry the units of heredity. This theory provided the foundation for understanding how traits are passed from parents to offspring.
Chromosomes are structures within cells that contain DNA and genes.
Genes are segments of DNA that code for specific traits.
The theory explains the physical basis for Mendel's laws of inheritance.
Model Organisms in Genetics: Drosophila melanogaster
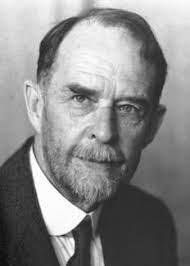
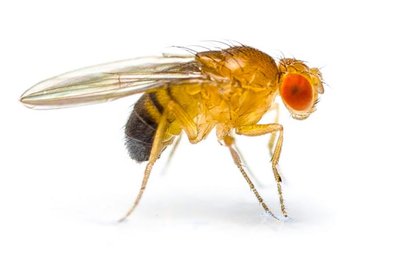
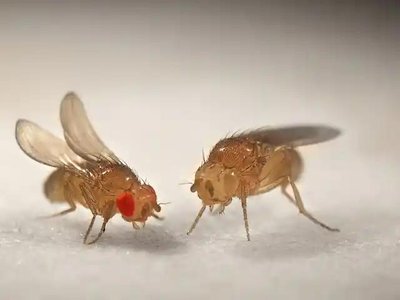
Thomas Hunt Morgan pioneered the study of chromosomal inheritance using Drosophila melanogaster (fruit fly), a model organism still widely used in genetics research.
Wild type: The most common phenotype for a trait.
Mutant: Individuals with traits caused by mutations.
Example: Red eyes are wild-type in fruit flies; white eyes are a mutation.
Sex Chromosomes and Sex Linkage
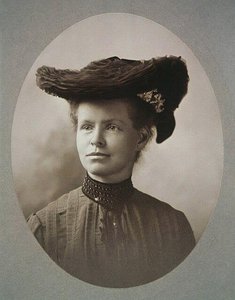
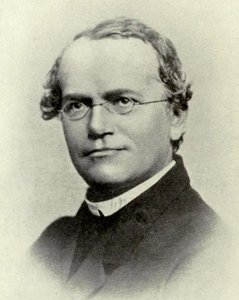
Sex chromosomes determine the sex of an organism and can carry genes that affect traits. Nettie Maria Stevens discovered the existence of X and Y chromosomes, establishing the basis for sex determination.
Females: XX (homogametic)
Males: XY (heterogametic)
Sex-linked genes are located on sex chromosomes (X or Y).
Reciprocal crosses in fruit flies revealed that eye color inheritance is linked to the X chromosome.
Sex Chromosome Systems in Animals
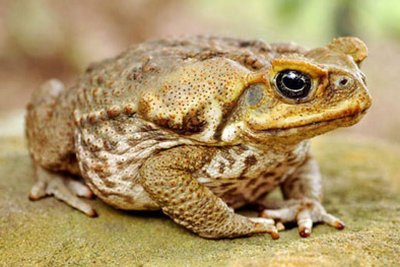
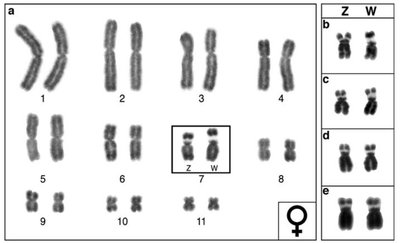
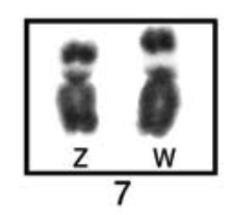
Not all animals use the XX/XY system. For example, amphibians and some reptiles use the ZZ/ZW system, where females are heterogametic (ZW) and males are homogametic (ZZ).
ZZ/ZW system: Found in some amphibians and reptiles.
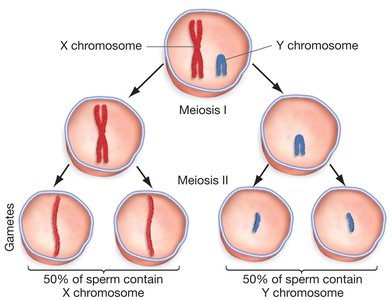
Sex chromosomes segregate during meiosis to form gametes with different sex chromosome compositions.
Linkage and Genetic Mapping
Linkage: Genes on the Same Chromosome
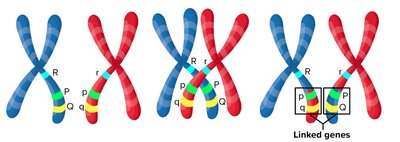
Linkage refers to the tendency of genes located on the same chromosome to be inherited together. This phenomenon can affect inheritance patterns and explains why some traits do not follow Mendel's ratios.
Linked genes: Genes located close together on the same chromosome.
Sex linkage: Genes located on sex chromosomes.
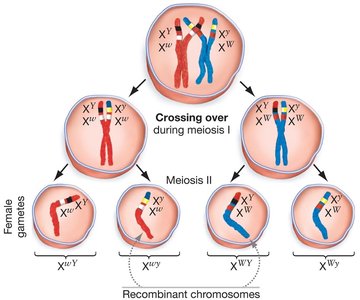
Crossing over during meiosis can separate linked genes, resulting in genetic recombination.
Genetic Mapping and Centimorgan
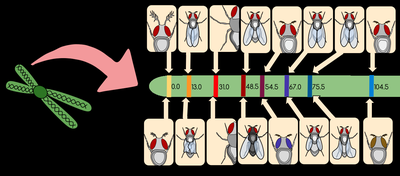
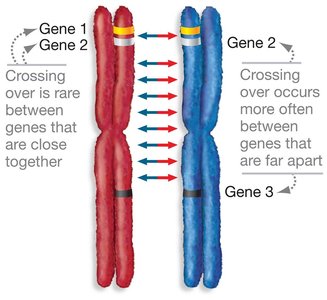
The frequency of crossing over between genes can be used to estimate their relative distance on a chromosome. The unit of measurement is the centimorgan (cM), named after T.H. Morgan.
Genetic map: Diagram showing the relative positions of genes.
Centimorgan (cM): Unit for measuring genetic linkage; 1 cM = 1% recombination frequency.
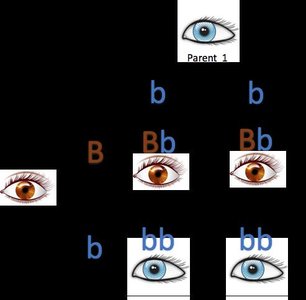
Alleles and Patterns of Inheritance
Multiple Alleles and Dominance Relationships
Genes can have more than two alleles, and the relationship between alleles can vary. Mendel studied traits with two alleles, but many genes have multiple alleles.
Complete dominance: Only the dominant allele's phenotype is observed in heterozygotes.
Codominance: Both alleles are expressed in the phenotype of heterozygotes (e.g., blood type).
Incomplete dominance: Heterozygotes have an intermediate phenotype (e.g., pink flowers from red and white parents).
Hardy-Weinberg Principle and Population Genetics
The Hardy-Weinberg Principle
The Hardy-Weinberg principle provides a mathematical model for studying allele and genotype frequencies in populations. It serves as a null hypothesis for evolutionary studies.
Gene pool: All alleles from all gametes in a population.
Allele frequencies: p (frequency of A1), q (frequency of A2);
Genotype frequencies: (A1A1), (A1A2), (A2A2);
Assumptions of Hardy-Weinberg Equilibrium
The Hardy-Weinberg model is based on five key assumptions:
Random mating
No natural selection
No genetic drift
No gene flow
No mutation
Testing for Hardy-Weinberg Equilibrium
To determine if a population is in Hardy-Weinberg equilibrium, scientists compare observed and expected genotype frequencies. Deviations indicate that evolutionary processes are occurring.
Calculate genotype frequencies from observed data.
Calculate allele frequencies from genotype frequencies.
Use allele frequencies to calculate expected genotype frequencies.
Statistically compare observed and expected values.
Example Calculations
Scenario 1: Lizard scale coloration (complete dominance, green dominant over blue)
Total individuals: 1600
GG: 240 (0.15), Gg: 1200 (0.75), gg: 160 (0.1)
Allele frequencies: G = (2*240 + 1200)/(2*1600) = 0.5; g = (2*160 + 1200)/(2*1600) = 0.5
Expected genotype frequencies under HW: GG = , Gg = , gg =
Compare observed and expected frequencies to assess selection.
Scenario 2: Rabbit ear type (no selection expected)
Total individuals: 2000
GG: 450, Gg: 990, gg: 560
Genotype frequencies: GG = 0.225, Gg = 0.495, gg = 0.28
Allele frequencies: G = (2*450 + 990)/(2*2000) = 0.4475; g = (2*560 + 990)/(2*2000) = 0.5525
Expected genotype frequencies under HW: GG = , Gg = , gg =
Compare observed and expected frequencies to assess selection.
Summary Table: Types of Inheritance
Type | Description | Example |
|---|---|---|
Autosomal | Gene located on non-sex chromosome | Eye color, blood type |
X-linked | Gene located on X chromosome | Red/white eye color in fruit flies |
Y-linked | Gene located on Y chromosome | Male-specific traits |
Complete dominance | Dominant allele masks recessive | Brown eyes over blue |
Codominance | Both alleles expressed | AB blood type |
Incomplete dominance | Intermediate phenotype | Pink flowers from red and white |
Key Equations
Allele frequencies:
Genotype frequencies:
Conclusion
This study guide covers the fundamental concepts of inheritance, sex chromosomes, genetic linkage, and population genetics, providing a comprehensive overview for General Biology students.
