 Back
Introduction to Biology and the Scientific Method
Study Guide - Smart Notes
 Tailored notes based on your materials, expanded with key definitions, examples, and context.
Introduction to Biology
Defining Life
Biology is the scientific study of life. Living organisms share several fundamental properties that distinguish them from non-living matter.
Membrane delimited: All living things are separated from their environment by a membrane, typically the plasma membrane in cells.
Information storage and transmission: Life stores and transmits instructions, primarily through genetic material such as DNA.
Energy transformation and use: Organisms store, transform, and utilize energy to maintain order and drive biological processes.
Response to environment: Living things control their functions and respond to environmental changes.
Self-replication: Life is capable of reproducing itself.
Evolution: Populations of organisms evolve over generations.
Biomolecules: The properties of life are facilitated by complex molecules such as proteins, nucleic acids, lipids, and carbohydrates.
Cellular basis: The cell is the smallest unit of life.
Example: A bacterium is a single-celled organism that can grow, reproduce, respond to its environment, and evolve over time.

Fundamental Concepts and Study Strategies
Building Knowledge in Biology
Understanding biology requires building upon fundamental concepts. Effective study habits are essential for mastering the material and succeeding in the course.
Set goals and schedule: Plan your reading, assignments, and class attendance.
Collaborative learning: Study groups and attending office hours can enhance understanding.
Active learning: Use concept maps, flashcards, and self-testing to reinforce knowledge.
Consistent review: Regular review helps retain information and prevents last-minute cramming.
Example: Explaining a concept to a peer without notes is an effective way to test your understanding.

Data and Graphical Analysis in Biology
Understanding Variables and Graphs
Biologists use data and graphs to analyze and present experimental results. Understanding how to interpret graphs is a key skill.
Independent variable (x-axis): The variable that is manipulated or categorized, such as time or treatment group.
Dependent variable (y-axis): The variable that is measured in response to changes in the independent variable, such as growth or response rate.
Types of graphs: Bar graphs, line graphs, and scatter plots are commonly used to display biological data.
Experimental Variable (Independent Variable) | Responding Variable (Dependent Variable) |
|---|---|
Factor of the experiment being tested | Result or change that occurs due to the experimental variable |
The Scientific Method
Steps of the Scientific Method
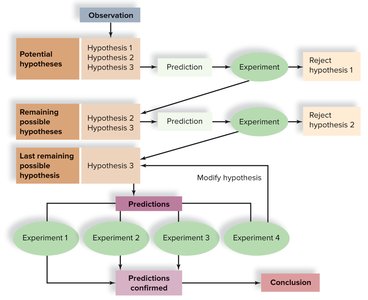
The scientific method is a systematic approach used to investigate natural phenomena. It involves making observations, forming hypotheses, making predictions, conducting experiments, and drawing conclusions.
Observation: Gathering information about a phenomenon or problem.
Hypothesis: A testable explanation for an observation.
Prediction: A logical statement about what will happen if the hypothesis is correct.
Experiment: A controlled test to evaluate the hypothesis, including a control group and experimental group.
Conclusion: Determining whether the results support or refute the hypothesis.
Controls in Experiments
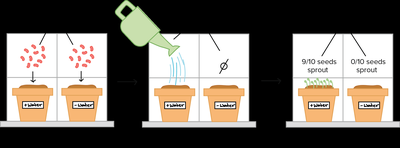
A control group is a subset of subjects in an experiment that does not receive the experimental treatment. It serves as a baseline for comparison, ensuring that observed effects are due to the variable being tested.
Example: In testing whether baking powder makes a cake airy, the control would be a cake made without baking powder, following the original recipe.
Application: Controls are essential for fair tests and valid conclusions in scientific research.
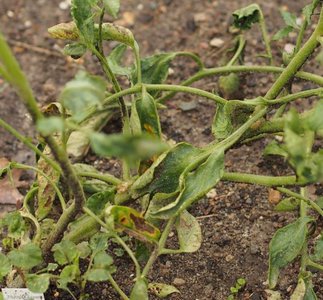
Example: Tomato Plant Experiment
Suppose you observe that your neighbor's tomato plants are healthier than yours. You hypothesize that a difference in watering frequency is responsible. You predict that increasing water will improve your plants' health. You set up an experiment with two groups: one with increased watering (experimental group) and one with normal watering (control group). The health of the plants is measured and compared.

Summary Table: Steps of the Scientific Method
Step | Description | Example |
|---|---|---|
Observation | Notice a phenomenon | Tomato plants are unhealthy |
Hypothesis | Propose explanation | Lack of water causes poor health |
Prediction | State expected outcome | More water will improve health |
Experiment | Test hypothesis with control | Increase water for one group, keep other normal |
Conclusion | Analyze results | Compare plant health between groups |
Additional info: The scientific method is iterative; hypotheses may be revised based on experimental results, and further testing may be required to reach robust conclusions.
