Back
BackIntroduction to Ecology and Population Ecology: Study Notes
Study Guide - Smart Notes
 Tailored notes based on your materials, expanded with key definitions, examples, and context.
Introduction to Ecology
What is Ecology?
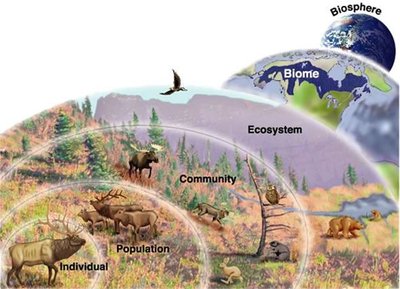
Ecology is the scientific study of the interactions between organisms and their environment. These interactions occur at multiple levels of biological organization, from individuals to the entire biosphere.
Individual: A single organism.
Population: A group of individuals of the same species living in a particular area.
Community: All the populations of different species living and interacting in an area.
Ecosystem: The community plus the abiotic (nonliving) environment.
Biome: Large regions characterized by specific types of climate and vegetation.
Biosphere: The global ecosystem; the sum of all Earth's ecosystems.
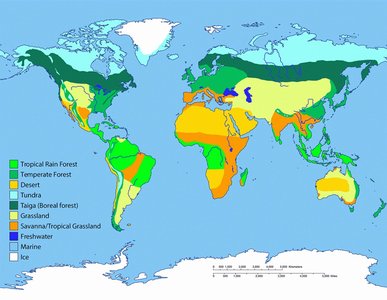
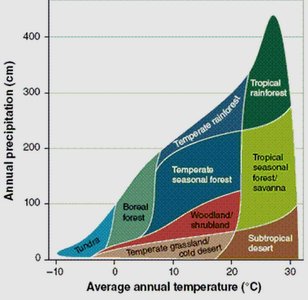
Biomes
Biomes are major life zones characterized by vegetation type (in terrestrial biomes) or physical environment (in aquatic biomes). The distribution of biomes is determined primarily by climate, especially temperature and precipitation.
Examples of terrestrial biomes: Tropical rain forest, temperate forest, desert, tundra, grassland, taiga (boreal forest).
Factors Affecting Biomes
The main factors that determine the distribution of biomes are precipitation and temperature. Each biome has a characteristic range of these factors.
Precipitation: Amount and seasonal pattern of rainfall or snowfall.
Temperature: Average annual temperature and its variation.
Climate
Climate refers to the long-term prevailing weather conditions in a given area. It is a key factor in determining the distribution of organisms and biomes.
Key components of climate: Temperature, precipitation, sunlight, and wind.
Climate and disturbance (such as fire or storms) control the distribution of terrestrial biomes.
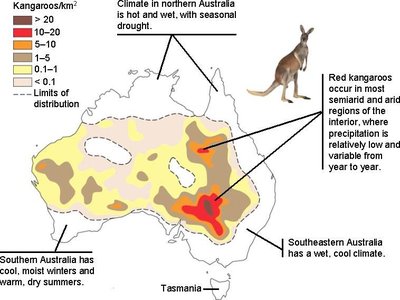
What Affects the Distribution of a Species?
The distribution of a species is influenced by both biotic (living) and abiotic (nonliving) factors.
Biotic factors: Interactions with other species (e.g., predation, competition, mutualism), behaviors.
Abiotic factors: Physical and chemical factors such as temperature, water, salinity, sunlight, and soil.
Temperature and water are often the most important abiotic factors.
Changing Biotic and Abiotic Factors
Changes in climate or other abiotic/biotic factors can alter the population sizes or distribution of many species. Some species may not be able to shift their ranges quickly enough to survive environmental changes.
Population Ecology
Populations and Population Ecology
A population is a group of individuals of a single species living in the same general area. Population ecology studies how biotic and abiotic factors influence the density, distribution, size, and age structure of populations.
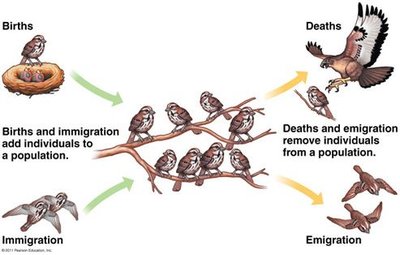
Density
Population density is the number of individuals per unit area or volume. Density can increase through births and immigration, and decrease through deaths and emigration.
Births and immigration: Add individuals to a population.
Deaths and emigration: Remove individuals from a population.
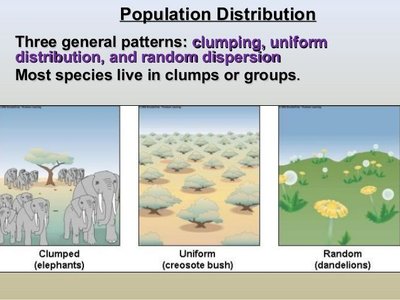
Dispersion
Dispersion refers to the pattern of spacing among individuals within the boundaries of the population. There are three main patterns:
Clumped: Individuals are grouped in patches, often around resources.
Uniform: Individuals are evenly spaced, often due to territoriality or competition.
Random: Individuals are spaced unpredictably.
Demography
Demography is the study of the vital statistics of a population, such as birth and death rates. Survivorship curves are graphical representations of the number of individuals surviving at each age.
Type I: Low death rate early and middle life, higher death rate in older age (e.g., humans).
Type II: Constant death rate over the organism's life span (e.g., some birds).
Type III: High death rate for young, lower for survivors (e.g., oysters, many fish).
Patterns of Reproduction
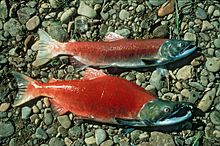
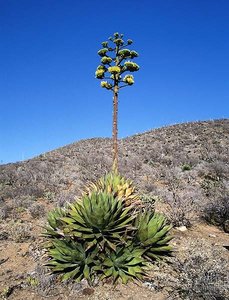
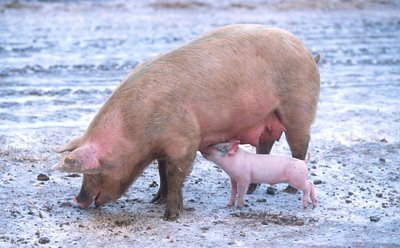
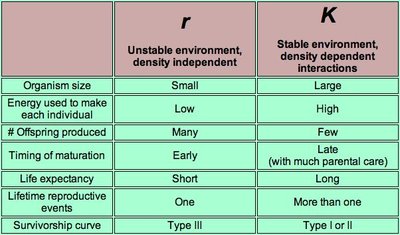
Species exhibit different reproductive strategies, often classified as r-selection (semelparity) or K-selection (iteroparity).
Semelparity (r-selection): "Big Bang" reproduction; many offspring produced at once, often in unstable environments. The individual often dies after reproduction.
Iteroparity (K-selection): Repeated reproduction; few, but larger offspring, often in stable environments.
r | K | |
|---|---|---|
Environment | Unstable, density independent | Stable, density dependent |
Organism size | Small | Large |
Energy used per individual | Low | High |
# Offspring produced | Many | Few |
Timing of maturation | Early | Late (with much parental care) |
Life expectancy | Short | Long |
Lifetime reproductive events | One | More than one |
Survivorship curve | Type III | Type I or II |
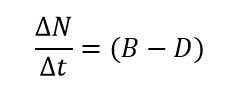
Change in Population Size
Population size changes according to the difference between birth rate (B) and death rate (D). This can be expressed as:
Population growth rate:
Per capita rate of increase (r):
When B = D, the population experiences zero growth.
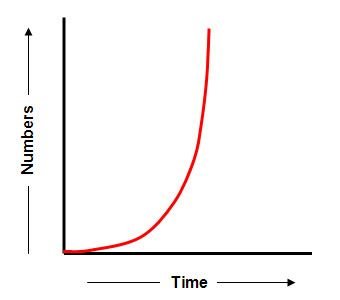
Exponential Growth Model
Exponential population growth occurs under ideal conditions with unlimited resources. The population increases at a constant rate per individual.
Equation:
rmax: Maximum per capita rate of increase for the species.
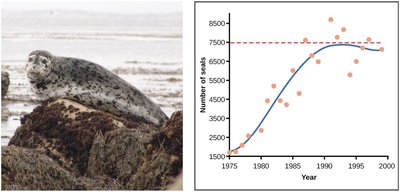
Carrying Capacity
The exponential growth model assumes unlimited resources, which is unrealistic in nature. Carrying capacity (K) is the maximum population size that a particular environment can sustain.
As population size approaches K, resources become limited and growth slows.
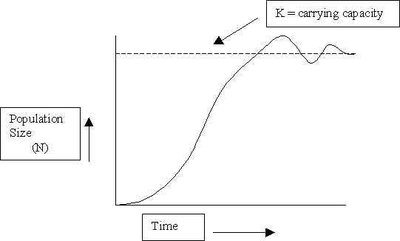
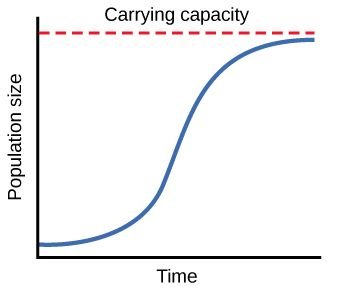
Logistic Growth Model
The logistic growth model incorporates carrying capacity. The per capita rate of increase decreases as the population size (N) approaches K.
Equation:
Population growth is rapid at first, then slows as it nears K.
Factors Limiting Population Growth
Population growth can be limited by density-dependent and density-independent factors.
Density-dependent factors: Effects increase as population density increases (e.g., predation, disease, competition, territoriality, waste accumulation).
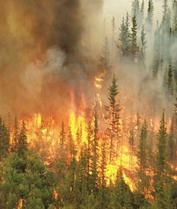
Density-independent factors: Effects are unrelated to population density (e.g., natural disasters such as floods, fires, weather events).
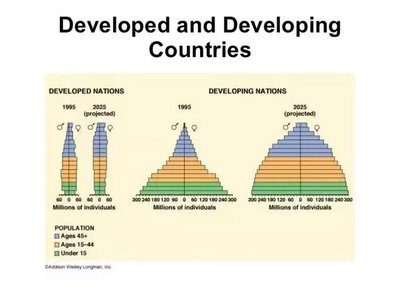
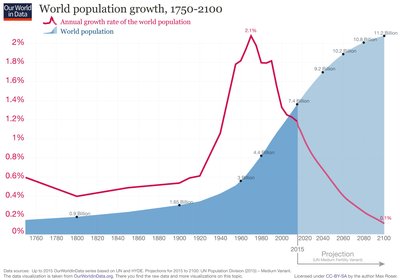
Human Population Growth
The human population is no longer growing exponentially but is still increasing rapidly. Demographic transition describes the shift from high birth and death rates to low birth and death rates as a country develops.
Population growth rates vary among countries and regions.
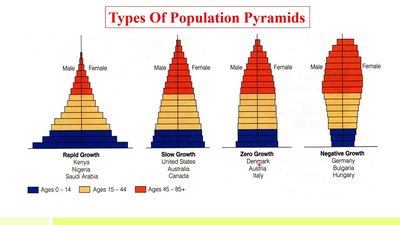
Age-Structure Pyramids
Age-structure pyramids show the relative number of individuals of each age in a population. They can be used to predict and explain demographic patterns, such as future population growth or decline.
Rapid growth: Wide base, many young individuals.
Slow growth: More even distribution among age groups.
Zero or negative growth: Narrow base, fewer young individuals.