 Back
BackIntroduction to Statistics in General Biology
Study Guide - Smart Notes
 Tailored notes based on your materials, expanded with key definitions, examples, and context.
Introduction to Statistics in Biology
Overview of Statistics in Biology
Statistics are essential tools in biology for collecting, processing, and interpreting quantitative data. They help biologists summarize observations, make predictions, and avoid drawing premature or unsupported conclusions. Understanding basic statistical concepts is crucial for analyzing experimental results and making informed scientific decisions.
Statistics: Methods used to collect, process, or interpret quantitative data.
Descriptive statistics: Summarize or describe observations/samples.
Inferential statistics: Use observations to make estimates or predictions about a population.
Descriptive Statistics
Measures of Central Tendency
Central tendency refers to the tendency of data to cluster around a central value. The three main measures are mean, median, and mode.
Mean: The average of a data set, calculated by summing all values and dividing by the number of data points.
Median: The middle value when data points are arranged in order. If there is an even number of data points, the median is the average of the two middle values. The median is less affected by extreme values (outliers).
Mode: The value that appears most frequently in a data set. Useful for categorical or bimodal data.
Example: In a sample of TikTok usage times (in minutes): 10, 55, 85, 25, 44, 37, 42, 201, 56, 59, the mean, median, and mode can be calculated to summarize the data.
Measures of Variability
Range and Standard Deviation
Variability measures how spread out the values in a data set are. Two common measures are range and standard deviation.
Range: The difference between the largest and smallest values. Only considers two values and does not reflect the distribution of all data points.
Standard deviation (s): Measures how much data points deviate from the mean. A low standard deviation indicates data are close to the mean, while a high standard deviation suggests greater spread.
Example: In the TikTok study, the range is calculated as the difference between the maximum (201) and minimum (10) values.
Normal Distribution
Many biological data sets follow a normal (bell-shaped) distribution, where most values cluster around the mean and fewer are found at the extremes. The standard deviation divides the distribution into predictable proportions.
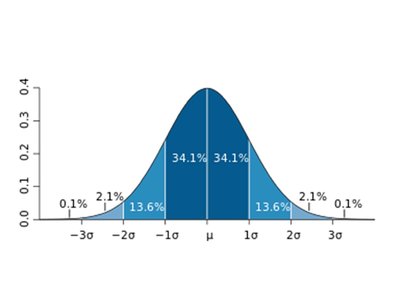
About 68% of observations lie within ±1 standard deviation of the mean.
About 95% lie within ±2 standard deviations.
About 99% lie within ±3 standard deviations.
Calculating Standard Deviation
The formula for standard deviation is:
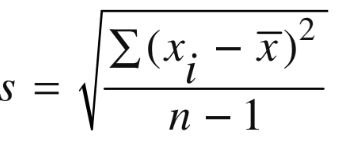
Step 1: Find the mean ().
Step 2: Subtract the mean from each data point and square the result.
Step 3: Sum the squared deviations.
Step 4: Divide by degrees of freedom (n-1), then take the square root.
Example: Heights of tomato plants (mm): 65, 52, 71, 56, 61.
Plant | Height (mm) | x - \overline{x} | (x - \overline{x})^2 |
|---|---|---|---|
1 | 65 | 4 | 16 |
2 | 52 | -9 | 81 |
3 | 71 | 10 | 100 |
4 | 56 | -5 | 25 |
5 | 61 | 0 | 0 |
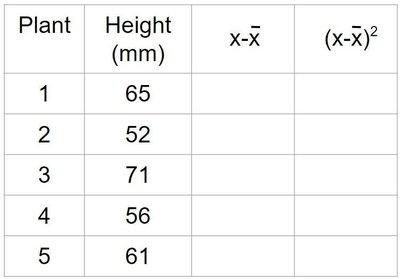
Sum of squared deviations = 222; n = 5; degrees of freedom = 4.
This means that most plant heights are within 7.45 mm of the mean height (61 mm).
Inferential Statistics
Standard Error of the Mean (SEM)
The standard error of the mean (SEM or SEx) estimates how well the sample mean represents the true population mean. It depends on the standard deviation and the sample size.
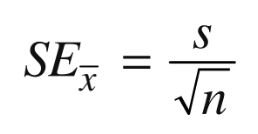
Lower SEM indicates higher confidence in the sample mean.
Increasing sample size decreases SEM.
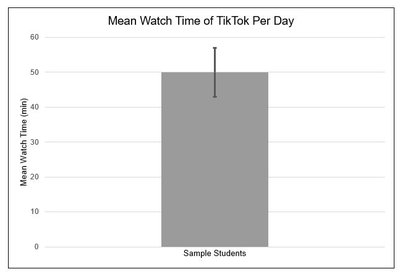
Example: For a sample mean TikTok watch time of 50 min, standard deviation 35, and sample size 100:
This means the sample mean is expected to vary by about 3.5 minutes from the true population mean.
Standard Error Bars
Standard error bars are plotted on graphs to show the variability of the sample mean. In biology, error bars typically represent ±2 SEM, which corresponds to a 95% confidence interval.
If error bars overlap, differences between means are likely not statistically significant.
If error bars do not overlap, differences may be significant, but further statistical tests are needed for confirmation.
Statistical Tests
Chi-Square Test (Goodness of Fit)
The chi-square test compares observed results with expected results to determine if deviations are due to chance or other factors. It is commonly used for categorical data.
The formula for the chi-square statistic is:

Null hypothesis: The observed data matches the expected results.
If the calculated value is greater than the critical value from the chi-square table, the null hypothesis is rejected.
Summary Table: Key Statistical Measures
Measure | Purpose | Formula |
|---|---|---|
Mean | Average value | |
Median | Middle value | -- |
Mode | Most frequent value | -- |
Range | Spread of values | max - min |
Standard Deviation (s) | Spread from mean | |
Standard Error (SEM) | Precision of mean | |
Chi-square () | Goodness of fit |
Additional info: These statistical concepts are foundational for interpreting experimental data in biology, especially in topics such as genetics, ecology, and physiology. Mastery of these tools enables students to critically evaluate scientific claims and design robust experiments.
