Back
BackIntroduction to the Scientific Method, Metric System, and Data Graphing
Study Guide - Smart Notes
 Tailored notes based on your materials, expanded with key definitions, examples, and context.
Introduction to the Scientific Method, Metric System, and Data Graphing
Overview
This guide introduces foundational concepts in scientific investigation, measurement, and data analysis. Students will learn the steps of the scientific method, the use of metric units, how to convert between units, and the principles of graphing experimental data. These skills are essential for conducting and interpreting experiments in biology and other sciences.
The Scientific Method
Definition and Steps
The scientific method is a systematic approach used by scientists to explore observations, answer questions, and test hypotheses. It ensures that scientific inquiry is logical, repeatable, and based on empirical evidence.
Observation: Gathering information about phenomena or previous research.
Question: Formulating a testable question based on observations.
Hypothesis: Proposing a testable explanation or prediction.
Experiment: Designing and conducting experiments to collect data.
Analysis: Interpreting data to draw conclusions.
Conclusion: Determining whether the hypothesis is supported or refuted.
Reporting: Sharing results with the scientific community for peer review.
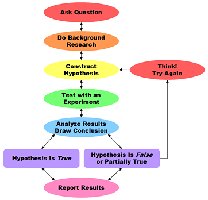
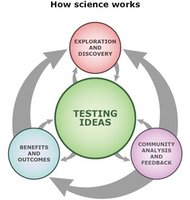
Modern science recognizes the scientific method as a flexible, iterative process involving collaboration, revision, and peer feedback.
Key Terms
Hypothesis: A testable statement predicting the outcome of an experiment.
Variable: Any factor that can change in an experiment.
Independent Variable: The variable that is deliberately changed or manipulated.
Dependent Variable: The variable that is measured and expected to change in response to the independent variable.
Controlled Experiment: An experiment in which only one variable is changed at a time, while all others are kept constant.
Accuracy and Precision in Measurement
Definitions
Accuracy: How close a measured value is to the true or accepted value.
Precision: How close repeated measurements are to each other, regardless of their accuracy.
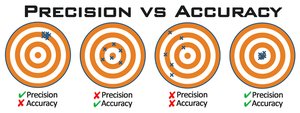
Accurate measurements are essential for reliable scientific results. Precision ensures consistency, while accuracy ensures correctness.
The Metric System
SI Units and Prefixes
The metric system (SI units) is the standard for scientific measurement. It is based on powers of ten, making conversions straightforward.
Length: meter (m)
Volume: liter (L)
Mass: gram (g) (kilogram is the SI base unit)
Temperature: kelvin (K), degrees Celsius (°C)
Time: second (s)
Electric current: ampere (A)
Luminous intensity: candela (cd)
Amount of substance: mole (mol)
Metric Prefixes
Prefix | Symbol | Exponential Form | Decimal Form |
|---|---|---|---|
mega- | M | 1,000,000 | |
kilo- | k | 1,000 | |
hecto- | h | 100 | |
deka- | da | 10 | |
base | (n/a) | 1 | |
deci- | d | 0.1 | |
centi- | c | 0.01 | |
milli- | m | 0.001 | |
micro- | \u03bc | 0.000001 | |
nano- | n | 0.000000001 | |
pico- | p | 0.000000000001 | |
femto- | f | 0.000000000000001 |
Metric Conversions
To convert between metric units, move the decimal point according to the difference in powers of ten between the prefixes.
Example 1: km to dm: ; move decimal 4 places right: $0.301$ km = $3010$ dm
Example 2: \u03bcm to cm: ; move decimal 4 places left: $10592.7$ \u03bcm = cm
Example 3: $750-9 - 1 = -10 nm = dam
Laboratory Equipment for Measuring Volume
Common Laboratory Glassware
Beaker: Used for mixing, stirring, and heating liquids; not for precise measurements.
Erlenmeyer Flask: Used for mixing by swirling and for titrations; not for precise volume measurement.
Graduated Cylinder: Used for measuring exact volumes of liquids.
Volumetric Flask: Used for preparing precise standard solutions.
Each piece of equipment has a specific purpose and capacity. Familiarity with their use is essential for accurate measurements.
Graphing Data
Purpose and Types of Graphs
Graphs are visual tools for presenting data, revealing patterns, trends, and relationships that may not be obvious in tables. Choosing the correct type of graph is crucial for clear communication.
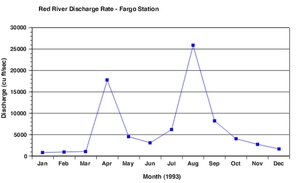
Line Graph: Shows changes over time or continuous data. Data points are connected by straight lines.
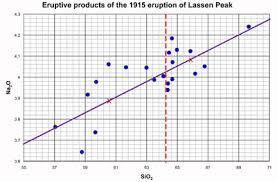
Scatter Plot: Shows the relationship between two variables. A best fit line (linear or curved) may be added to indicate correlation.
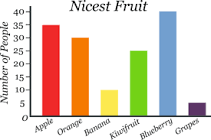
Bar Graph: Compares quantities across different categories.
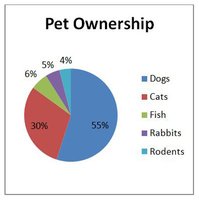
Pie Chart: Shows proportions of a whole.
Graphing Guidelines
Label axes with units.
Choose appropriate divisions to maximize graph size and clarity.
Give each graph a descriptive title.
Select the graph type that best matches the data and the point you wish to communicate.
Key Definitions for Data Analysis
Bar Graph: Used to compare quantities among categories.
Line Graph: Used to display data that changes continuously over time.
Pie Chart: Used to show proportions of a whole.
Scatter Plot: Used to show the relationship between two variables.
Best Fit Line: A straight or curved line that best represents the data trend in a scatter plot.
Practice: Experimental Data Analysis
Example Data Sets
Students are provided with sample data sets to practice forming hypotheses, identifying variables, graphing data, and drawing conclusions. For each data set:
State a hypothesis based on the experiment description.
Identify the independent and dependent variables.
Graph the data using the appropriate graph type.
Draw a conclusion from the graphed data.
Safety Note
Always pay attention to safety symbols and instructions in the laboratory. Proper disposal of materials and awareness of hazards are essential for safe lab practice.