Back
L 1.3: Lab Math and Graphing for Biology: Foundations for Data Analysis and Taxonomy
Study Guide - Smart Notes
 Tailored notes based on your materials, expanded with key definitions, examples, and context.
L 1.3
Lab Math: Significant Figures and Rounding
Understanding Significant Figures
Significant figures are crucial in scientific measurements, ensuring that reported data reflects the precision of the measurement tools used. Proper use of significant figures prevents overstatement of accuracy in experimental results.
Leading zeros are never significant (e.g., 0.00682 has 3 significant figures).
Embedded zeros are always significant (e.g., 1.072 has 4 significant figures).
Trailing zeros are significant only if a decimal point is specified (e.g., 300.0 has 4 significant figures, 300 has 1).
When rounding numbers, round to the nearest value based on the required number of significant figures. Special rules apply when the digit to be dropped is 5:
If the preceding digit is odd, round up.
If the preceding digit is even, leave it unchanged.
Example: Round 2.35 × 10² to 2 significant figures: 2.4 × 10².
Applications in Laboratory Settings
When multiplying measured values, the result should have the same number of significant figures as the least precise measurement.
Specifications and reporting must match the precision required (e.g., impurity levels reported to the correct decimal place).
Example: If a lab method requires 2.834 g NaCl and you need four times as much, report 11.34 g (4 significant figures).
Graphing in Biology: Types and Applications
Line Graphs vs. Bar Graphs
Graphs are essential for visualizing biological data. The choice of graph depends on the nature of the data and the message to be conveyed.
Line Graphs/Scatter Plots: Show changes in a variable over a continuous range (e.g., time, temperature). Useful for trends and relationships.
Bar Graphs: Used for categorical or discontinuous data, such as frequency distributions.
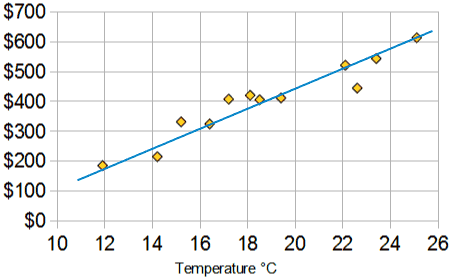
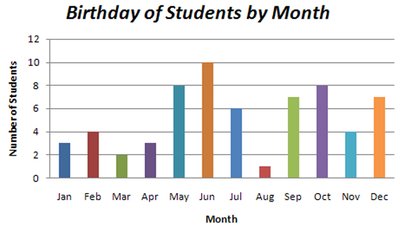
When plotting multiple data sets, use different colors or symbols and include a legend.
Graph Paper Types: Cartesian vs. Semi-log
Different types of graph paper are used depending on the data's nature:
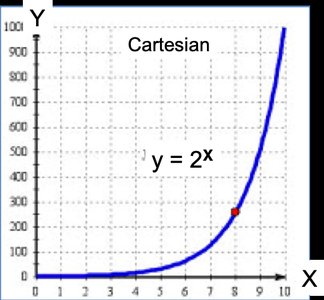
Cartesian (rectangular) paper: Best for linear or slowly changing data.
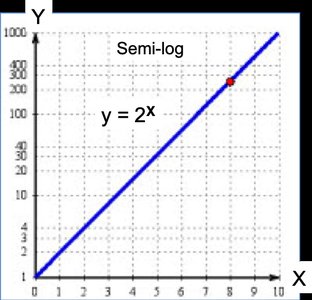
Semi-log paper: Used for data with exponential growth, compressing the Y-axis to better visualize rapid changes.
Exponential and Logistic Growth in Biology
Population Growth Models
Biological populations can grow in different patterns depending on environmental constraints:
Exponential Growth: Occurs when resources are unlimited. Population size increases rapidly over time.
Logistic Growth: Occurs when resources become limited. Population growth slows and stabilizes at the carrying capacity (K).
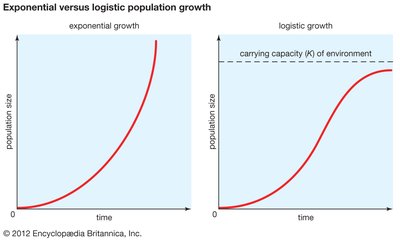
Example: Darwin recognized that populations have the potential for exponential growth, but environmental limits result in logistic growth.
Regression Analysis in Biological Data
Simple and Multiple Linear Regression
Regression analysis is used to model and analyze relationships between variables in biological research.
Simple Linear Regression: Models the relationship between one independent variable (predictor) and one dependent variable (response).
Multiple Linear Regression: Models the relationship between two or more independent variables and a dependent variable, revealing more complex influences.
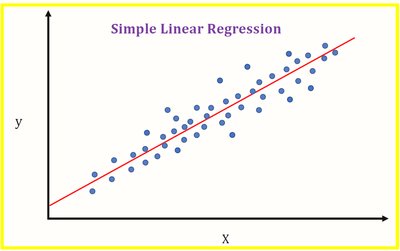
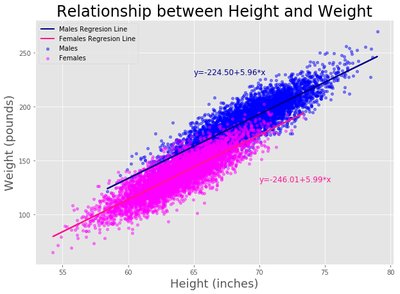
Regression analysis helps estimate coefficients for prediction and assess the strength of relationships (e.g., rainfall vs. soil erosion).
Linearity and Model Fit
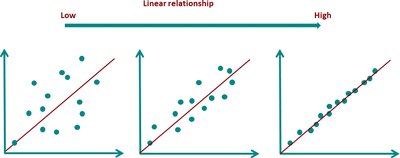
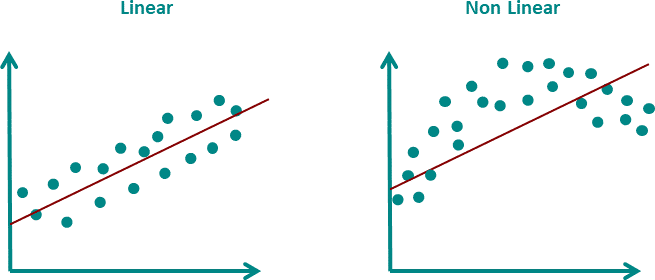
Linear regression assumes a straight-line relationship between variables. If the data are non-linear, a straight line will not accurately represent the relationship.
Correlation vs. Causation
Understanding Relationships in Data
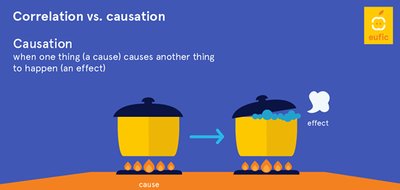
Correlation measures the strength and direction of a relationship between two variables, but does not imply causation. Causation means that one variable directly affects another.
Correlation: Two variables change together, but one does not necessarily cause the other.
Causation: One variable directly influences another.
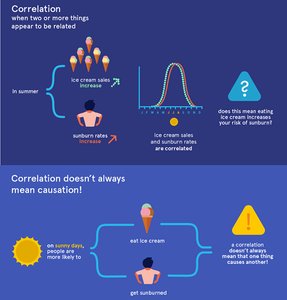
Example: Ice cream sales and sunburn rates are correlated in summer, but eating ice cream does not cause sunburn.
Taxonomic Systems in Biology
Classification Hierarchy
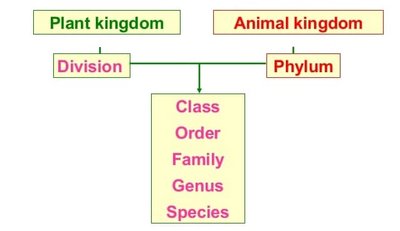
Taxonomy is the science of classifying living organisms. The hierarchy includes several ranks, with additional infra- and super-categories for more detailed classification.
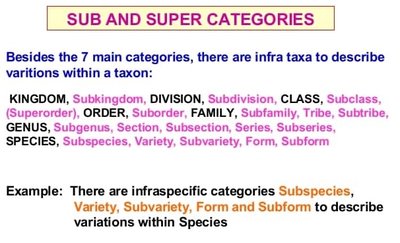
Major ranks: Kingdom, Division/Phylum, Class, Order, Family, Genus, Species
Infra- and super-categories: Subkingdom, Subclass, Suborder, Subspecies, Variety, Form, etc.
Infraspecific Categories and Definitions
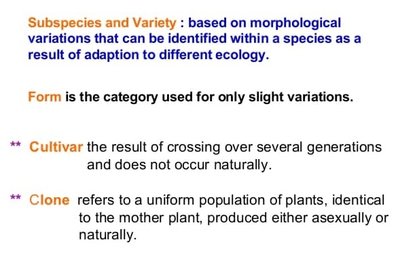
Subspecies and Variety: Morphological variations within a species due to adaptation to different ecologies.
Form: Used for slight variations.
Cultivar: Result of crossing over generations, not naturally occurring.
Clone: Uniform population of plants, genetically identical to the parent, produced asexually or naturally.
Local Botanical Resources
Botanical Gardens
Botanical gardens are valuable resources for studying plant diversity, taxonomy, and ecology. They provide living collections for education and research.
Mounts Botanical Garden (West Palm Beach)
Fairchild Tropical Botanic Garden (Coral Gables)