 Back
BackLinkage, Recombination, and Chromosome Mapping in Genetics
Study Guide - Smart Notes
 Tailored notes based on your materials, expanded with key definitions, examples, and context.
Linkage and Chromosome Mapping
Linked Genes and Genetic Linkage
Linked genes are genes located close together on the same chromosome and tend to be inherited together. This phenomenon is known as genetic linkage. The physical proximity of genes on a chromosome means that they are often passed as a unit during cell division, deviating from Mendel's law of independent assortment.
Definition: Linked genes are inherited together because they are physically close on the same chromosome.
Distance Effect: The closer two genes are, the less likely they are to be separated by recombination.
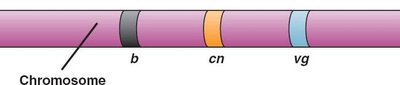
Example: Genes for body color and wing shape in Drosophila melanogaster are linked.
Deviation from Independent Assortment
When genes are linked, the results of genetic crosses deviate from the expected ratios predicted by Mendel's law of independent assortment.
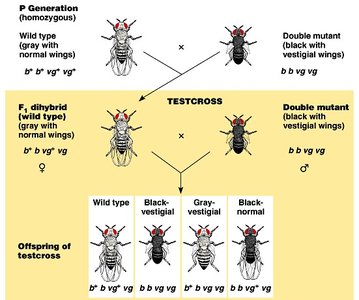
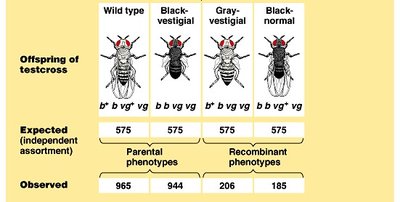
Expected Ratio: Under independent assortment, a dihybrid testcross should yield a 1:1:1:1 phenotypic ratio.
Linked Genes: If genes are completely linked, only parental phenotypes are observed (1:1:0:0 ratio).
Observed Ratio: Most offspring show parental phenotypes, but some recombinants occur, indicating incomplete linkage.
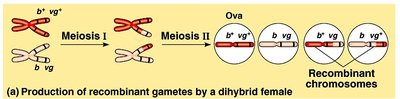
Mechanism of Recombination: Crossing Over
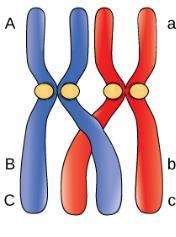
Recombination occurs when homologous chromosomes exchange segments during meiosis, producing new allele combinations. This process is called crossing over.
Definition: Crossing over is the exchange of genetic material between homologous chromosomes during meiosis.
Result: Recombinant chromosomes carry new combinations of alleles.
Example: In female flies, crossing over produces recombinant gametes.
Chromosome Mapping and Recombination Frequency
Chromosome Maps and Map Units
Geneticists use recombination data to construct chromosome maps, which are ordered lists of genetic loci. The recombination frequency between two genes is used to estimate their distance on a chromosome.
Map Unit: One map unit (centiMorgan, cM) equals 1% recombination frequency.
Linkage Map: Indicates relative distance and order of genes, not precise locations.
Example: Recombination frequencies between genes b, cn, and vg are used to map their positions.
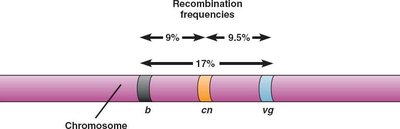
Gene Order Determination
The order of genes on a chromosome can be determined by comparing recombination frequencies.
Method: The gene pair with the highest recombination frequency is farthest apart.
Example: In Drosophila, the order b - cn - vg is determined by recombination frequencies of 9% (b-cn), 9.5% (cn-vg), and 17% (b-vg).
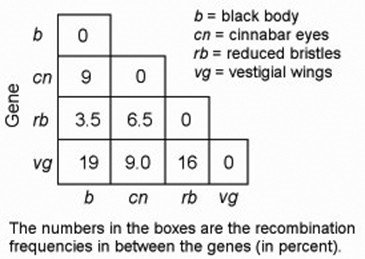
Linkage Map Table
The following table summarizes recombination frequencies between four linked genes in Drosophila:
Gene | b | cn | rb | vg |
|---|---|---|---|---|
b | 0 | 9 | 3.5 | 19 |
cn | 9 | 0 | 6.5 | 9 |
rb | 3.5 | 6.5 | 0 | 16 |
vg | 19 | 9 | 16 | 0 |
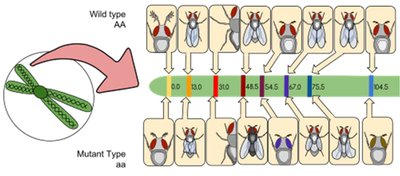
Cytological Maps and Absolute Distances
Cytological maps use chromosomal banding and other techniques to indicate gene positions relative to chromosomal features. Modern methods can show absolute distances in DNA nucleotides.
Cytological Map: Indicates gene positions with respect to chromosomal features.
Absolute Distance: Measured in base pairs (bp) using molecular techniques.
Genetic Crosses and Recombination Calculations
Example: Fruit Fly Cross
In a cross between wild-type and mutant fruit flies, the F2 progeny are counted to determine recombination frequency.
Cross Type: Testcross (heterozygote x homozygous recessive)
Interpretation: The presence of recombinant phenotypes indicates that the loci are linked but not completely.
Calculation: Recombination frequency = (Number of recombinants / Total offspring) × 100%
Formula:
Example: Maize Kernel Color and Plant Color
A similar approach is used in maize to determine linkage and recombination frequency between kernel color and plant color genes.
Cross Type: Testcross with homozygous recessive plants
Interpretation: Deviations from expected ratios indicate linkage.
Calculation: Recombination frequency is calculated as above.
Summary Table: Linkage and Mapping Concepts
Concept | Definition | Example/Application |
|---|---|---|
Genetic Linkage | Genes inherited together due to proximity on chromosome | Drosophila body color and wing shape |
Crossing Over | Exchange of segments between homologous chromosomes | Production of recombinant gametes |
Map Unit (cM) | 1% recombination frequency | Distance between b and vg genes |
Linkage Map | Ordered list of loci based on recombination | Drosophila chromosome map |
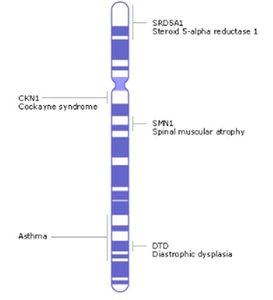
Cytological Map | Gene positions relative to chromosomal features | Chromosome 12 map |
Additional info: These notes expand on the original content by providing definitions, formulas, and examples for clarity and completeness.
