 Back
Chapter 13 Lecture
Study Guide - Smart Notes
 Tailored notes based on your materials, expanded with key definitions, examples, and context.
Meiosis: The Reduction Division
Introduction to Meiosis
Meiosis is a specialized type of cell division that reduces the chromosome number by half, producing haploid gametes (sperm and eggs) from diploid cells. This process is essential for sexual reproduction and ensures genetic diversity in offspring.
Haploid (n): Cells with one set of chromosomes (e.g., human gametes, n = 23).
Diploid (2n): Cells with two sets of chromosomes (e.g., human somatic cells, 2n = 46).
Meiosis: Reduces chromosome number from diploid to haploid.
Fertilization: Fusion of haploid gametes restores diploid number.
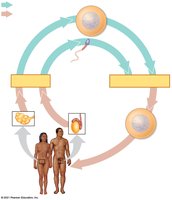
The Sexual Life Cycle
Alternation of Haploid and Diploid States
Sexual reproduction involves an alternation between haploid and diploid states. Meiosis and fertilization are the key events that maintain this cycle.
Haploid cells: Contain one of each chromosome type.
Diploid cells: Contain two of each chromosome type (one from each parent).
Meiosis: Produces haploid gametes from diploid cells.
Fertilization: Restores diploid state by combining two haploid gametes.
Homologous Chromosomes
Structure and Function
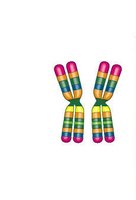
Homologous chromosomes are pairs of chromosomes (one from each parent) that have the same length, centromere position, and gene loci, but may carry different alleles.
Maternal homologs: Inherited from the mother.
Paternal homologs: Inherited from the father.
Alleles: Different versions of the same gene found on homologous chromosomes.
Overview of Meiosis
Phases of Meiosis
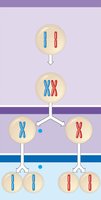
Meiosis consists of two sequential divisions: Meiosis I and Meiosis II. Each division has distinct phases that contribute to the reduction of chromosome number and the generation of genetic diversity.
Interphase: Chromosomes replicate during S phase, forming sister chromatids.
Meiosis I: Homologous chromosomes separate, producing two haploid cells with duplicated chromosomes.
Meiosis II: Sister chromatids separate, resulting in four haploid cells with unduplicated chromosomes.
Unique Events in Meiosis
Synapsis and Crossing Over
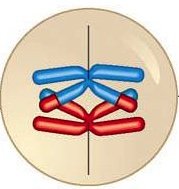
Synapsis is the pairing of homologous chromosomes during Prophase I, forming tetrads. Crossing over occurs at chiasmata, where non-sister chromatids exchange genetic material, creating recombinant chromosomes and increasing genetic diversity.
Synapsis: Homologs pair up and align gene by gene.
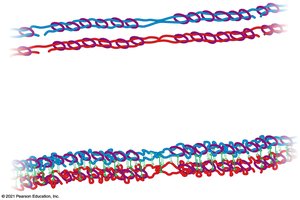
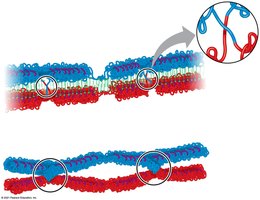
Crossing over: Exchange of DNA segments between non-sister chromatids at chiasmata.
Chiasmata: X-shaped regions where crossing over occurs.
Recombinant chromosomes: Chromosomes with new combinations of alleles.
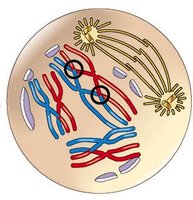
Mechanism of Crossing Over
Step 1: DNA breaks at the same point on two non-sister chromatids.
Step 2: DNA re-seals, connecting non-sister chromatids and forming chiasmata.
Genetic Variation in Meiosis
Independent Assortment
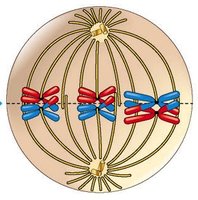
During Metaphase I, tetrads align randomly at the metaphase plate. The orientation of maternal and paternal homologs is independent for each pair, leading to a variety of possible gamete combinations.
Independent assortment: Random distribution of homologous chromosomes to daughter cells.
Result: Gametes contain different combinations of maternal and paternal chromosomes.
Random Fertilization
Genetic diversity is further increased by the random combination of gametes during fertilization, resulting in unique offspring.
Comparison of Mitosis and Meiosis
Key Differences
Mitosis and meiosis are both forms of cell division, but they serve different purposes and have distinct outcomes.
Feature | Mitosis | Meiosis |
|---|---|---|
Number of divisions | 1 | 2 |
Number of daughter cells | 2 | 4 |
Chromosome number in daughter cells | Diploid (2n) | Haploid (n) |
Genetic identity | Identical to parent | Genetically unique |
Role | Growth, repair | Gamete production |
Gametogenesis: Spermatogenesis vs. Oogenesis
Formation of Gametes
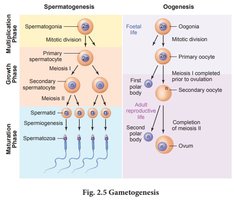
Gametogenesis is the process by which gametes are produced through meiosis. In males, all four products of meiosis become sperm. In females, only one product becomes an ovum, while the others form polar bodies due to unequal cytoplasmic division.
Spermatogenesis: All four daughter cells mature into sperm.
Oogenesis: Only one daughter cell matures into an ovum; the rest become polar bodies.
Summary Table: Sources of Genetic Variation in Sexual Reproduction
Source of Variation | Stage | Description |
|---|---|---|
Crossing Over | Prophase I | Exchange of genetic material between non-sister chromatids |
Independent Assortment | Metaphase I & Anaphase I | Random orientation and separation of homologous chromosomes |
Random Fertilization | Fertilization | Random combination of gametes from two parents |
Best Practices for Studying Meiosis
Intermittent Studying
To maximize retention and recall, study a topic intensively, take a break for 24–48 hours, then attempt to recall and write out everything you remember before reviewing your notes. Repeat this process to strengthen neural pathways and improve long-term memory.
Lab Applications and Data Analysis
Calculating Photosynthesis Rates (PSN)
In laboratory settings, photosynthetic rates can be measured using DCPIP as an electron acceptor. The rate is determined by plotting DCPIP concentration over time and calculating the slope of the initial linear portion of the curve.
Convert absorbance values to DCPIP concentration using a standard curve.
Plot DCPIP concentration (mM) versus time for each sample.
The absolute value of the initial slope represents the rate of photosynthesis (mM DCPIP/min).
Scientific Writing and Academic Integrity
Lab Report Guidelines
Include at least three citations in both the Introduction and Discussion sections.
Cite your textbook, lab handout, and at least one primary article.
Use your own words and avoid plagiarism by taking notes in bullet points and not copying sentences directly.
References
Urry, et al., 2021 (Textbook)
Naganuma & Roffey, 2018 (Lab Manual)
Primary research article (as assigned)
