 Back
BackModeling Evolution and Natural Selection: Study Guide for BIOL 1209
Study Guide - Smart Notes
 Tailored notes based on your materials, expanded with key definitions, examples, and context.
Modeling Evolution and Natural Selection
Introduction to Evolutionary Modeling
Evolution is defined as the change in the genetic makeup of a population over time. In biological studies, modeling evolution involves tracking changes in allele frequencies and genetic variation across generations. Understanding these changes is essential for interpreting evolutionary processes such as natural selection, genetic drift, and mutation.
Key Concepts in Evolution
Allele Frequency and Genetic Variation
Allele frequency refers to how common an allele is in a population. Genetic variation is the diversity of alleles and genotypes within a population, providing the raw material for evolution.
Mutation: The source of new genetic variation. Mutations can be deleterious, neutral, or beneficial.
Natural Selection: The process by which individuals with higher fitness (better adapted to the environment) are more likely to survive and reproduce.
Genetic Drift: Random changes in allele frequencies, especially significant in small populations, which can lead to loss or fixation of alleles.
Fitness and Its Role in Evolution
Fitness is a measure of an organism's ability to survive and reproduce in its environment. Even small differences in fitness can have large effects on allele frequencies over time.
High fitness: Increases the likelihood of an allele being passed on.
Low fitness: Decreases the likelihood of an allele being passed on.
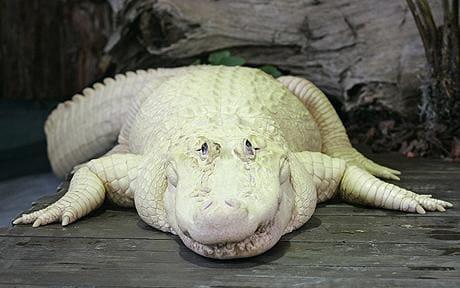
Example: Leucistic American Alligator
Leucism is a genetic mutation resulting in reduced pigmentation. This rare phenotype demonstrates how mutations can introduce variation into a population.
Genetic Drift and Population Size
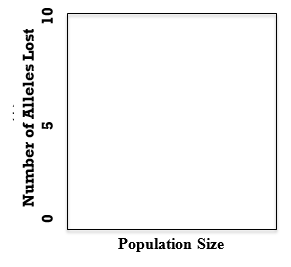
Genetic drift is more pronounced in small populations, where random events can lead to the loss of alleles, reducing genetic variation and potentially limiting the population's ability to adapt to environmental changes.
Fixation: When an allele's frequency reaches 1 (100%) in the population.
Loss: When an allele's frequency drops to 0 (completely lost from the population).
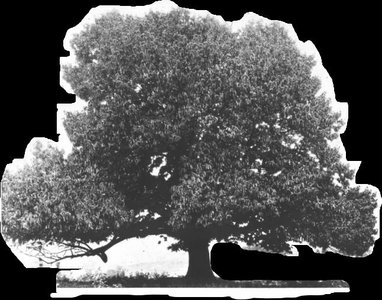
Example: The American chestnut tree population was decimated by blight due to the absence of a resistant allele, illustrating the importance of genetic variation for survival.
Modeling Evolution: Hardy-Weinberg Equilibrium
Genetic Equilibrium
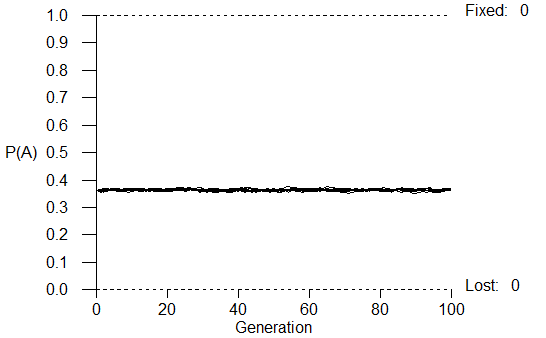
The Hardy-Weinberg equilibrium describes a population in which allele frequencies remain constant from generation to generation in the absence of evolutionary pressures. This model serves as a null hypothesis for detecting evolution.
Assumptions: No mutation, random mating, no gene flow, infinite population size, and no selection.
Equation: where p and q are the frequencies of two alleles.
Experimental Approaches: Replica Plating and Fitness Measurement
Replica Plating Analysis
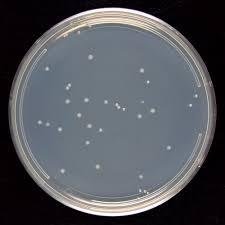
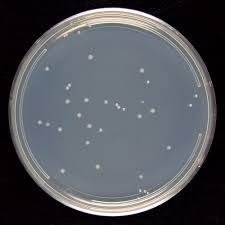
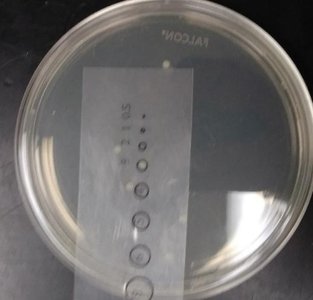
Replica plating is a laboratory technique used to study bacterial resistance and mutation. By transferring colonies to plates with varying antibiotic concentrations, researchers can determine whether resistance arises from pre-existing variation or induced mutation.
Pre-existing variation: Colonies appear in both low and high antibiotic plates.
Induced mutation: Colonies arise only in higher antibiotic concentrations.
Measuring Fitness in Bacterial Colonies
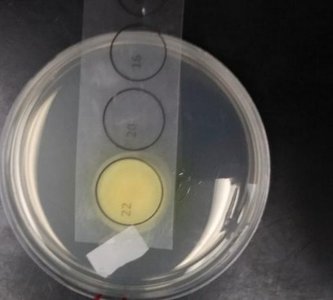
Fitness can be quantified by the percentage of plate covered by colonies or by the size of individual colonies. Larger colonies or greater coverage indicate higher fitness.
Fitness = 1: Colony is present and large.
Fitness < 1: Colony is present but smaller.
Fitness = 0: Colony is absent.
Graphing and Data Analysis in Evolutionary Experiments
Graphing Allele Loss and Population Size
Scientists often present the same data in multiple ways to highlight different aspects of evolutionary change. For example, plotting the number of alleles lost against population size can illustrate the impact of genetic drift.
AMP Simulations and Evolutionary Pressures
AMP (Allele Modeling Program) simulations allow students to model evolutionary pressures such as selection, mutation, and genetic drift. By adjusting parameters like fitness and mutation rate, students can observe their effects on allele frequencies over generations.
Independent variable: The factor manipulated (e.g., fitness of a specific allele).
Dependent variable: The outcome measured (e.g., frequency of an allele).
Writing and Analyzing Evolutionary Experiments
Scientific Writing in Evolutionary Biology
Effective scientific writing requires clear hypotheses, accurate methods, and well-constructed graphs. Key elements include:
Introduction: State the scientific question and provide background with references.
Methods: Describe the experimental setup, variables, and data collection process.
Results: Present data with appropriate graphs and statistical analysis.
Discussion: Interpret results, relate to hypothesis, and discuss implications.
References: Cite all sources in APA format.
Calculating Phenotype Percentages
For a gene with two alleles, the percentage of a dominant phenotype can be calculated as:
Formula: where p is the frequency of the dominant allele and q is the frequency of the recessive allele.
Summary Table: Key Evolutionary Processes
Process | Definition | Effect on Population |
|---|---|---|
Mutation | Random change in DNA sequence | Introduces new alleles |
Natural Selection | Non-random increase in frequency of beneficial alleles | Increases adaptation |
Genetic Drift | Random change in allele frequencies | Can lead to loss or fixation of alleles |
Gene Flow | Movement of alleles between populations | Increases genetic variation |
Best Practices for Success in Evolutionary Biology Labs
Prepare by completing pre-readings and taking notes during experiments.
Work collaboratively with peers and participate in group discussions and graphing activities.
Identify independent and dependent variables in all experiments.
Practice data collection, graphing, and statistical analysis.
Seek feedback and use office hours for additional help.
