 Back
BackPhylogenies and Cladograms: Understanding Evolutionary Relationships
Study Guide - Smart Notes
 Tailored notes based on your materials, expanded with key definitions, examples, and context.
Phylogenies and Cladograms
Introduction to Phylogenies and Cladograms
Phylogenies and cladograms are essential tools in evolutionary biology for visualizing the relationships among species. They help scientists infer the evolutionary history and shared ancestry of organisms by analyzing traits and genetic information.
Key Terms and Concepts
Phylogeny: The evolutionary history of a species or group of related species.
Phylogenetic Tree: A diagram that represents evolutionary relationships among organisms based on shared characteristics.
Cladogram: A type of phylogenetic tree that shows the branching patterns of evolution without indicating time or genetic distance.
Evolutionary Tree: Another term for a phylogenetic tree, emphasizing the depiction of evolutionary pathways.
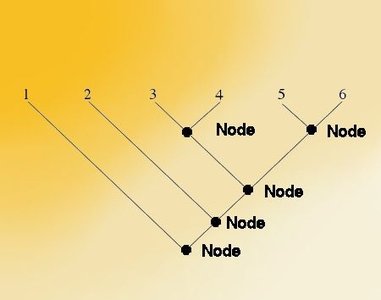
Nodes and Branches
In phylogenetic trees and cladograms, nodes represent common ancestors from which descendant species diverge. The branches can be rotated around nodes without changing the relationships depicted.
Node: Each branch point on a tree, representing a common ancestor.
Branch: A line representing the evolutionary lineage of a species or group.
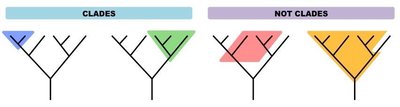
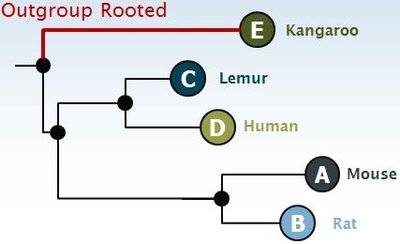
Clades and Outgroups
A clade is a group of organisms that includes an ancestor and all its descendants. Identifying clades is crucial for understanding evolutionary relationships. An outgroup is a species or group that is closely related to but not part of the group under study, used to root the tree and infer ancestral traits.
Clade: A monophyletic group consisting of an ancestor and all its descendants.
Outgroup: An organism or group outside the group of interest, used as a reference point for evolutionary studies.
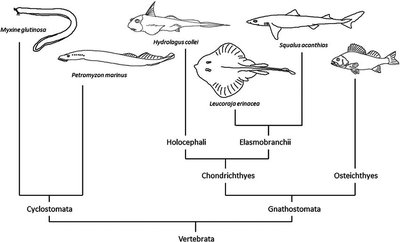
Structure and Interpretation of Cladograms
Cladograms can be drawn in various formats, but all depict the same relationships. The direction of time is typically from the root (common ancestor) toward the tips (modern species). The arrangement of branches does not affect the interpretation of evolutionary relationships.
Cladograms may be linear, rectangular, or circular.
All modern species are placed at the tips of branches.
Branching order reflects hypothesized evolutionary relationships.
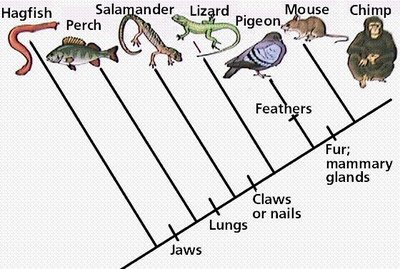
Constructing Cladograms
Cladograms are constructed by grouping organisms based on shared derived traits (synapomorphies) inherited from a common ancestor. The process involves identifying traits, determining their distribution among species, and arranging branches to reflect evolutionary history.
Identify shared traits among organisms.
Determine which traits are ancestral and which are derived.
Group organisms by shared derived traits to form clades.
Place the outgroup to root the tree and infer trait evolution.
Practice: Building and Interpreting Cladograms
To practice, students may be asked to construct a cladogram using a set of organisms and a table of traits. The goal is to label when each trait evolved and to place all modern species at the tips of branches.
Start with the trait present in all organisms (ancestral trait).
Identify the next most common trait and branch accordingly.
Continue branching as new traits appear in subsets of organisms.


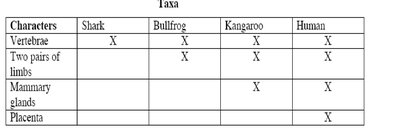
Example: Vertebrate Cladogram
The following table summarizes the presence of key traits in several vertebrate taxa. This information can be used to construct a cladogram showing evolutionary relationships.
Characters | Shark | Bullfrog | Kangaroo | Human |
|---|---|---|---|---|
Vertebrae | X | X | X | X |
Two pairs of limbs | X | X | X | |
Mammary glands | X | X | ||
Placenta | X |
Applications and Activities
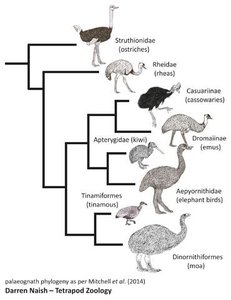
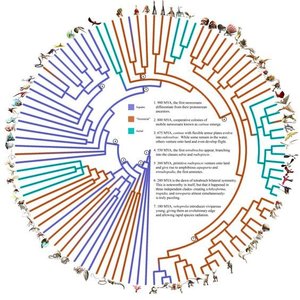
Cladograms are used in various biological investigations, such as studying adaptive radiation (e.g., anole lizard evolution), analyzing molecular evidence (e.g., primate relationships), and classifying organisms based on morphological or genetic traits.
Toolbox Cladogram: Practice constructing a tree using everyday objects (e.g., screws) to understand trait-based grouping.
Alien Characteristics: Apply cladogram construction to hypothetical organisms.
Primate Cladogram: Use molecular data to infer evolutionary relationships among primates.
Summary
Understanding phylogenies and cladograms is fundamental for interpreting evolutionary relationships. Mastery of these concepts enables students to analyze biological diversity, trace the origin of traits, and appreciate the dynamic history of life on Earth.
