 Back
BackPhylogeny and the Tree of Life: Structured Study Notes
Study Guide - Smart Notes
 Tailored notes based on your materials, expanded with key definitions, examples, and context.
Phylogeny and the Tree of Life
Introduction to Systematics and Taxonomy
Systematics is the scientific discipline that classifies organisms and determines their evolutionary relationships. Taxonomy, a branch of systematics, is concerned with naming and classifying organisms. Understanding these fields is essential for interpreting the diversity of life and its evolutionary history.
Taxonomy: The science of classifying and naming organisms.
Systematics: Determines evolutionary relationships among organisms.
Phylogeny: The evolutionary history of a species or group of related species.
Binomial Nomenclature
Binomial nomenclature is the formal system of naming species introduced by Carolus Linnaeus. Each species is given a two-part scientific name, which is universally recognized and used in biological classification.
Genus: The first part of the name, capitalized.
Specific epithet: The second part, unique within the genus, not capitalized.
Species name: Both parts together, italicized (e.g., Panthera pardus).
Hierarchical Classification
Organisms are classified in a hierarchy of categories, from broad to specific. This structure helps organize biological diversity and reflects evolutionary relationships.
Order, Family, Genus, Species: Examples of taxonomic ranks.
Linking Classification and Phylogeny
Phylogenetic trees represent hypotheses about evolutionary relationships. Linnaean classification and phylogeny may differ, and modern systematists aim to classify only groups that include a common ancestor and all its descendants.
Branch point: Represents divergence of two species.
Sister taxa: Groups sharing an immediate common ancestor.
Rooted tree: Includes a branch representing the last common ancestor.
Basal taxon: Diverges early and originates near the common ancestor.
Polytomy: Branch from which more than two groups emerge.
Interpreting Phylogenetic Trees
Phylogenetic trees show patterns of descent, not phenotypic similarity. They do not indicate when species evolved or how much change occurred in a lineage. It is incorrect to assume that a taxon evolved from the taxon next to it.
Inferring Phylogenies: Morphological and Molecular Data
Phylogenies are inferred from morphological and molecular data. Systematists gather information about morphologies, genes, and biochemistry of living organisms to construct evolutionary relationships.
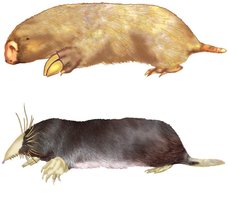
Homology: Phenotypic and genetic similarities due to shared ancestry.
Analogy: Similarity due to convergent evolution, not shared ancestry.
Evaluating Molecular Homologies
Systematists use computer programs and mathematical tools to analyze comparable DNA segments from different organisms. Insertions and deletions in DNA sequences are important for evaluating molecular homologies.

Cladistics and Clades
Cladistics groups organisms by common descent. A clade is a group of species that includes an ancestral species and all its descendants. Clades can be nested within larger clades, but not all groupings qualify as clades.
Monophyletic group: Consists of the ancestor species and all its descendants.
Paraphyletic group: Includes an ancestral species and some, but not all, descendants.
Polyphyletic group: Includes distantly related species but not their most recent common ancestor.
Shared Ancestral and Shared Derived Characters
Organisms have both shared and different characteristics compared to their ancestors. These characters are used to infer evolutionary relationships.
Shared ancestral character: Originated in an ancestor of the taxon (e.g., backbone).
Shared derived character: Evolutionary novelty unique to a particular clade (e.g., hair).
A character can be both ancestral and derived, depending on context.
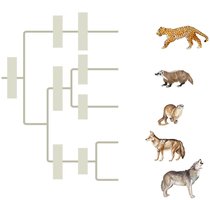
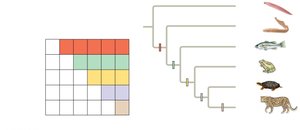
Inferring Phylogenies Using Derived Characters
Knowing in which clade a shared derived character first appeared is useful for inferring evolutionary relationships. Systematists use character tables and phylogenetic trees to visualize these relationships.
Visualizing Phylogenetic Relationships
Phylogenetic trees can be drawn in various orientations without changing the relationships. The order of taxa at branch tips is not significant; the branching pattern signifies the order of divergence.
Phylogenetic Trees with Proportional Branch Lengths
Branch length in phylogenetic trees can represent chronological time or the number of genetic changes. Fossil records and DNA sequence data are used to determine branching points and lengths.
Outgroups in Phylogenetic Analysis
An outgroup is a species or group that diverged before the ingroup. Comparing ingroup species with the outgroup helps differentiate between shared derived and shared ancestral characteristics.
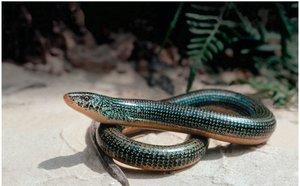
Lost Features as Shared Derived Characters
Lost features, such as the loss of limbs in snakes or whales, can be considered shared derived characters. Whether a character is ancestral or derived is relative to the context.
Maximum Parsimony and Maximum Likelihood
Systematists use principles of maximum parsimony and maximum likelihood to narrow down possible phylogenetic trees.
Maximum parsimony: The most likely tree requires the fewest evolutionary events.
Maximum likelihood: Identifies the tree most likely to have produced a given set of DNA data based on probability rules.
Phylogenetic Trees as Hypotheses
Phylogenetic trees are hypotheses that can be tested. Phylogenetic bracketing predicts that features shared by two closely related groups will be present in their ancestor and all descendants.
Let’s Check Your Understanding
Sample Questions and Concepts
Which of the following taxonomic categories includes the fewest number of species?
Answer: Genus (e.g., Panthera)
Animals that possess homologous structures probably _____.
Answer: Evolved from a common ancestor
Which would be the most suitable outgroup species for a cladogram involving the other answer choices?
Answer: Tuna (as it diverged before the other vertebrates listed)

When describing a group of animals, you speak about an ancestral species and some but not all of its descendants. This is an example of a _____.
Answer: Paraphyletic group

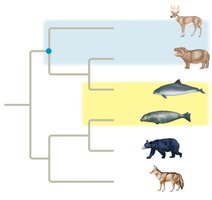
According to this tree, which is most distantly related to the other even-toed ungulates?
Answer: Cetaceans
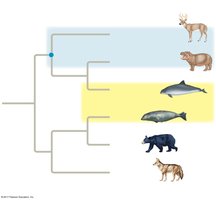
Which would be the best outgroup for this tree?
Answer: Jellyfish (jellies)

You are studying a strange new organism. Examination of its structure shows it to be truly multicellular. Where would you begin to classify it?
Answer: Eukarya
Which of the following could be homologous between two taxa?
Answer: All of the above (two bones, two limbs, two leaves, two genes)
Key Terms and Concepts Table
Term | Definition | Example |
|---|---|---|
Taxonomy | Classification and naming of organisms | Panthera pardus |
Phylogeny | Evolutionary history of a species | Phylogenetic tree |
Homology | Similarity due to shared ancestry | Forelimbs of mammals |
Analogy | Similarity due to convergent evolution | Wings of birds and insects |
Clade | Group including ancestor and all descendants | Mammals |
Monophyletic | Ancestor and all descendants | Vertebrates |
Paraphyletic | Ancestor and some descendants | Reptiles (excluding birds) |
Polyphyletic | Distantly related species, no common ancestor | Marine mammals |
Formulas and Equations
Maximum Parsimony Principle:
Maximum Likelihood Principle:
Additional info: Some explanations and examples were expanded for clarity and completeness based on standard biology textbook content.
