 Back
BackPhylogeny and the Tree of Life: Study Notes
Study Guide - Smart Notes
 Tailored notes based on your materials, expanded with key definitions, examples, and context.
Phylogeny and the Tree of Life
Introduction to Phylogeny and Systematics
Understanding the evolutionary relationships among organisms is a central goal of biology. Phylogeny refers to the evolutionary history of a species or group of related species, while systematics is the discipline that classifies organisms and determines their evolutionary relationships.
Phylogenetic tree: A branching diagram representing evolutionary relationships among taxa.
Systematics: Integrates data from morphology, genes, and biochemistry to infer phylogeny.
Binomial Nomenclature and Hierarchical Classification
Modern taxonomy, established by Carolus Linnaeus, uses a two-part naming system and organizes species into a hierarchy of increasingly broad categories.
Binomial nomenclature: Each species is assigned a two-part Latin name: the genus (capitalized) and the specific epithet (lowercase, unique within the genus). Example: Puma concolor.
Hierarchical classification: Species are grouped into a hierarchy: Domain, Kingdom, Phylum, Class, Order, Family, Genus, Species.
Taxon: Any named group at any level of the hierarchy.


Linking Classification and Phylogeny
Classification systems aim to reflect evolutionary relationships, but traditional groupings do not always match phylogenetic relationships. Advances in molecular biology have led to reclassification based on genetic evidence.
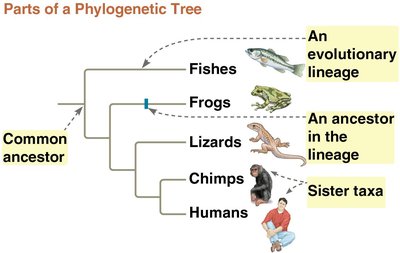
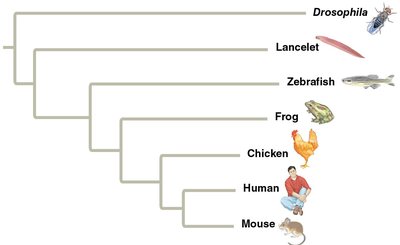
Phylogenetic trees are hypotheses about evolutionary relationships.
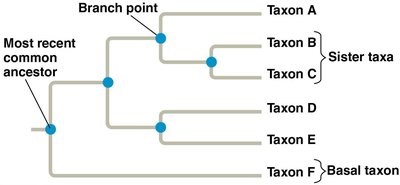
Branch points (nodes) represent divergence from a common ancestor.
Sister taxa: Groups that share an immediate common ancestor.
Basal taxon: A lineage that diverges early and remains unbranched.


What Phylogenetic Trees Show (and Do Not Show)
Phylogenetic trees illustrate patterns of descent, not phenotypic similarity, timing of divergence, or the amount of evolutionary change.
Do not assume that a taxon evolved from the taxon next to it.
Tree shape (vertical, horizontal, diagonal) does not affect the relationships depicted.
Inferring Phylogeny: Morphological and Molecular Data
Systematists use both morphological and molecular data to infer evolutionary relationships. Only features resulting from common ancestry (homologies) are useful for constructing phylogenies.
Homology: Similarity due to shared ancestry (e.g., similar bone structures in mammals).
Analogy: Similarity due to convergent evolution, not common ancestry (e.g., wings of bats and birds).
Complex structures and extensive genetic similarity are more likely to be homologous.


Cladistics and Clades
Cladistics is a method of systematics that groups organisms by common ancestry. A clade includes an ancestral species and all its descendants.
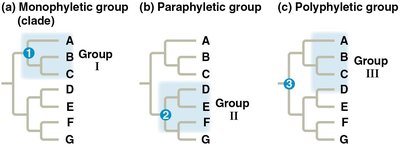
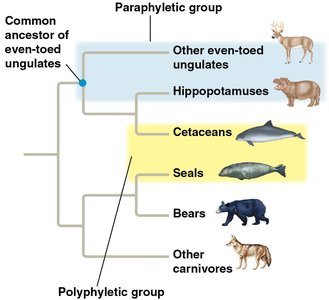
Monophyletic group (clade): Ancestor and all descendants.
Paraphyletic group: Ancestor and some, but not all, descendants.
Polyphyletic group: Distantly related species but not their most recent common ancestor.

Shared Ancestral and Shared Derived Characters
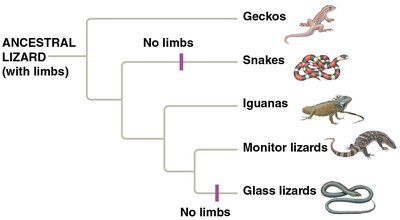
Characters used in cladistics are classified as either shared ancestral characters (originated in an ancestor) or shared derived characters (evolutionary novelties unique to a clade).
Lost features (e.g., loss of limbs in snakes) can be shared derived characters.
Whether a character is ancestral or derived depends on the context of the group being studied.

Branch Lengths in Phylogenetic Trees
Branch lengths in phylogenetic trees can represent the number of genetic changes or the passage of time, depending on the data and tree construction method.
Shorter branches indicate fewer genetic changes.
Fossil data can calibrate branch points to geological time.

Constructing Phylogenetic Trees: Parsimony and Likelihood
Systematists use computational methods to find the most likely phylogenetic tree based on available data.
Maximum parsimony: The simplest explanation (fewest evolutionary changes) is preferred.
Maximum likelihood: Identifies the tree most likely to have produced the observed data, given specific models of DNA change.
Phylogenetic Trees as Hypotheses
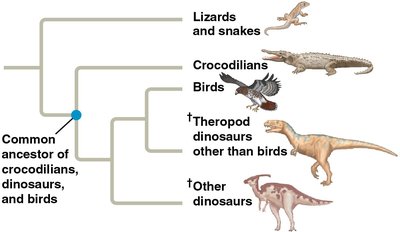
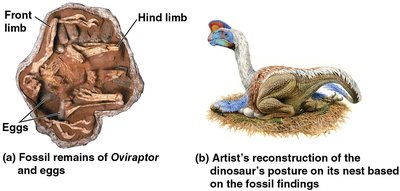
Phylogenetic trees are hypotheses that can be tested by making predictions. Phylogenetic bracketing predicts that features shared by two closely related groups are present in their common ancestor and all descendants.
Example: Birds and crocodiles share nest building and brooding; fossils suggest dinosaurs did as well.
Changing Views of the Tree of Life
Our understanding of the tree of life has changed with new data, especially from molecular studies.
Early classification: Two kingdoms (plants, animals), then five kingdoms (Monera, Protista, Plantae, Fungi, Animalia).
Current system: Three domains—Bacteria, Archaea, and Eukarya.
Protista is no longer a kingdom due to its members' diverse evolutionary relationships.
Horizontal Gene Transfer and the Tree of Life
Horizontal gene transfer (HGT) is the movement of genes between genomes, which complicates the reconstruction of evolutionary relationships.
HGT can occur via plasmids, viruses, or fusion of organisms.
It has played a significant role in the evolution of both prokaryotes and eukaryotes.
Some biologists propose that the base of the tree of life is better represented as a network rather than a simple branching tree.
Summary Table: Types of Taxonomic Groups
Group Type | Definition | Example |
|---|---|---|
Monophyletic | Ancestor and all descendants | All mammals |
Paraphyletic | Ancestor and some descendants | Reptiles (excluding birds) |
Polyphyletic | Distantly related species, not most recent common ancestor | Marine mammals (whales, seals) |
Key Terms: phylogeny, systematics, taxonomy, binomial nomenclature, taxon, clade, homology, analogy, parsimony, likelihood, horizontal gene transfer.
