 Back
Population and Community Ecology: Structure, Dynamics, and Interactions
Study Guide - Smart Notes
 Tailored notes based on your materials, expanded with key definitions, examples, and context.
Population Ecology
Dynamic Biological Processes in Populations
Population ecology examines how and why populations change over time and space. Populations are groups of individuals of the same species living in a defined area, and their dynamics are influenced by birth rates, death rates, immigration, and emigration. Evolutionary processes and resource availability play central roles in shaping population structure and growth.
Population boundaries and size are fundamental descriptors.
Birth rate and death rate are key demographic factors.
Resource access and individual behavior affect reproductive success and population growth.
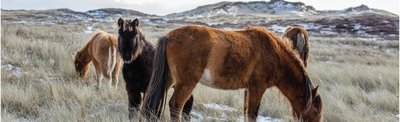
Density and Dispersion
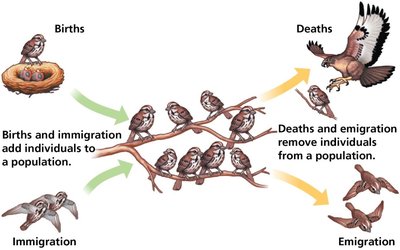
Population density is the number of individuals per unit area or volume, while dispersion describes the spatial arrangement of individuals within the population's boundaries. These patterns are shaped by environmental and social factors.
Density is dynamic, influenced by births, deaths, immigration, and emigration.
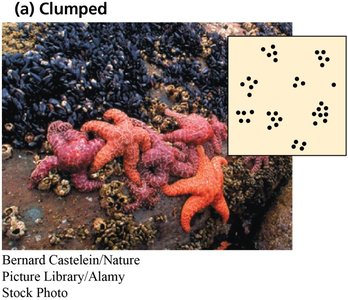
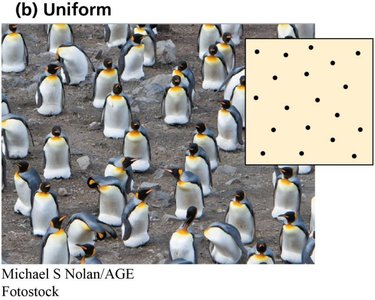
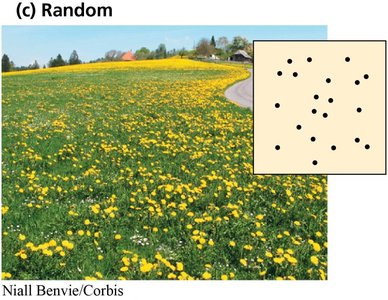
Dispersion patterns include clumped, uniform, and random distributions.
Patterns of Dispersion
Clumped dispersion: Individuals aggregate in patches, often due to resource availability or social behavior.
Uniform dispersion: Individuals are evenly spaced, often due to territoriality or competition.
Random dispersion: The position of each individual is independent of others, occurring in the absence of strong attractions or repulsions.
Demographics and Life Tables
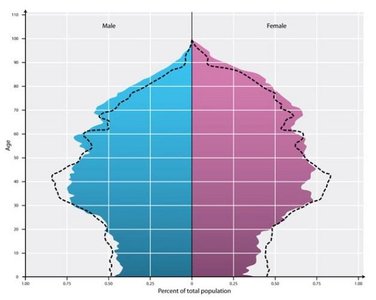
Demography is the study of vital statistics (such as birth and death rates) and how they change over time. Life tables and survivorship curves are tools used to summarize demographic data and predict population trends.
Life table: Age-specific summary of survival and reproductive rates within a population, often constructed by following a cohort (group of individuals of the same age).
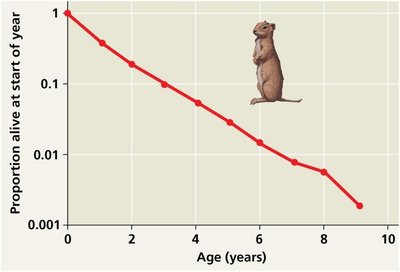
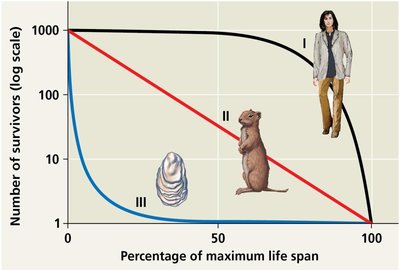
Survivorship curve: Graphical representation of the number of individuals surviving at each age.
Types of Survivorship Curves
Type I: Low death rates during early and middle life, high death rates in older age (e.g., humans).
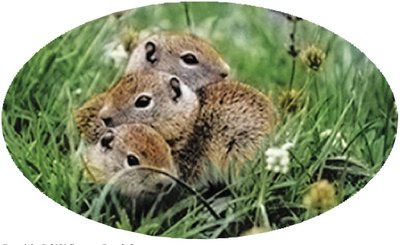
Type II: Constant death rate over the lifespan (e.g., ground squirrels).
Type III: High death rates for young, lower for survivors (e.g., oysters).
Reproductive Rates and Methods
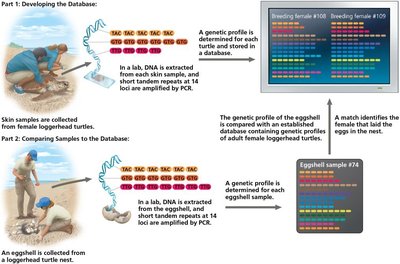
Reproductive tables (fertility schedules) summarize age-specific reproductive rates, focusing on the number of breeding females. Modern molecular tools, such as genetic profiling, can be used to estimate reproductive output and identify parentage in wild populations.
Direct counts, mark-recapture, and genetic analysis are common methods.
Population Growth Models
Population growth can be modeled mathematically to predict changes under different environmental conditions. Two primary models are the exponential and logistic growth models.
Exponential Growth Model
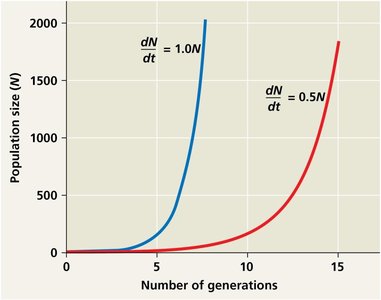
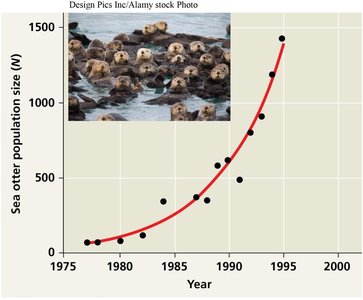
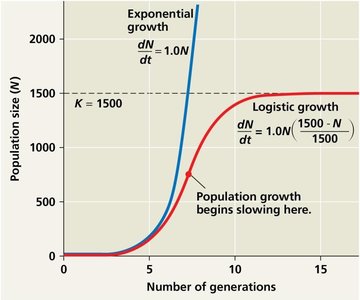
Describes population growth in an ideal, unlimited environment. The rate of increase is constant, resulting in a J-shaped curve.
Equation:
rmax: Maximum per capita rate of increase.
Population accumulates more individuals per unit time as it grows.
Logistic Growth Model
Incorporates environmental limits by introducing carrying capacity (K), the maximum population size the environment can sustain. Growth slows as the population approaches K, producing an S-shaped (sigmoid) curve.
Equation:
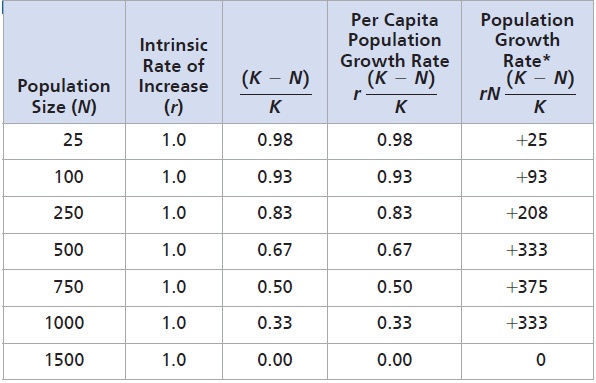
When N is small, growth is nearly exponential; as N approaches K, growth slows and eventually stops.
Population Size (N) | Intrinsic Rate of Increase (r) | \(\frac{K-N}{K}\) | Per Capita Population Growth Rate \(r\frac{K-N}{K}\) | Population Growth Rate* \(rN\frac{K-N}{K}\) |
|---|---|---|---|---|
25 | 1.0 | 0.98 | 0.98 | +25 |
100 | 1.0 | 0.93 | 0.93 | +93 |
250 | 1.0 | 0.83 | 0.83 | +208 |
500 | 1.0 | 0.67 | 0.67 | +333 |
750 | 1.0 | 0.50 | 0.50 | +375 |
1000 | 1.0 | 0.33 | 0.33 | +333 |
1500 | 1.0 | 0.00 | 0.00 | 0 |
Real Populations and Model Limitations
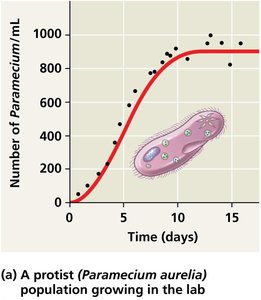
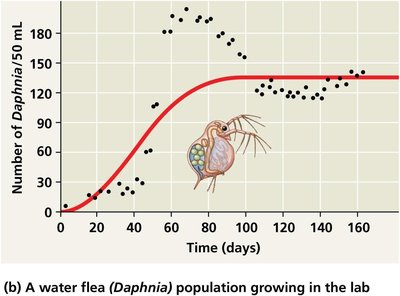
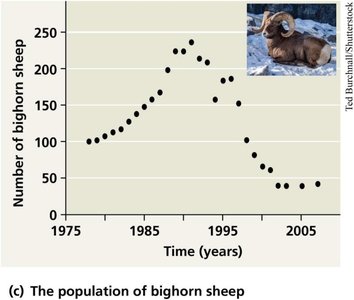
Laboratory populations (e.g., Paramecium, Daphnia) often fit the logistic model.
Natural populations may overshoot K, fluctuate, or show Allee effects (difficulty surviving/reproducing at low densities).
Community Ecology
Community Structure and Interactions
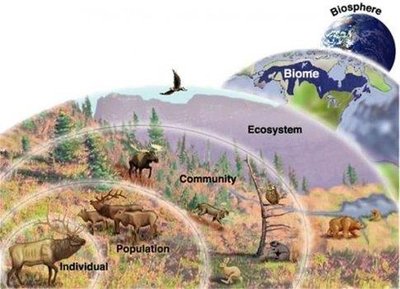
A biological community consists of populations of different species living close enough for potential interaction. Community ecology explores how species interactions (competition, predation, mutualism, etc.) shape community structure and dynamics.
Types of Interspecific Interactions
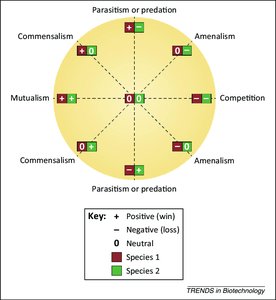
Competition (−/−): Both species are harmed by shared resource use.
Predation ( +/− ) and Herbivory ( +/− ): One species benefits, the other is harmed.
Parasitism ( +/− ): Parasite benefits, host is harmed.
Mutualism ( +/+ ): Both species benefit.
Commensalism ( +/0 ): One benefits, the other is unaffected.
Facilitation ( +/+ or 0/+ ): At least one benefits, neither is harmed.
Competition and Ecological Niches
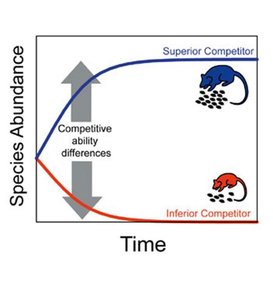
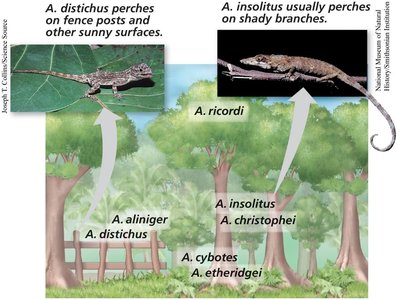
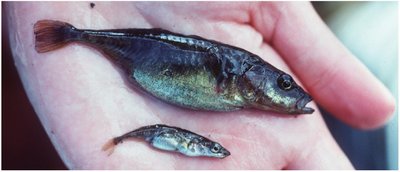
Competition for limited resources can lead to competitive exclusion, where one species outcompetes another. The ecological niche is the sum of a species' use of resources and its role in the environment. Resource partitioning and character displacement allow similar species to coexist by minimizing direct competition.
Fundamental niche: Potentially occupied by a species.
Realized niche: Actually occupied, often reduced by competition.
Summary Table: Population Growth Models
Model | Equation | Curve Shape | Key Features |
|---|---|---|---|
Exponential | J-shaped | Unlimited resources, constant r | |
Logistic | S-shaped (sigmoid) | Growth slows as N approaches K |
Additional info: These notes integrate foundational concepts from population and community ecology, including mathematical models, demographic analysis, and the ecological significance of species interactions. The included images and tables reinforce key concepts and provide visual examples relevant to the study of population and community dynamics.
