 Back
BackPopulation Characteristics and Dispersion Patterns
Study Guide - Smart Notes
 Tailored notes based on your materials, expanded with key definitions, examples, and context.
Population Characteristics
Definition and Key Measurements
A population is a group of individual organisms of the same species living together in the same geographic area. Understanding populations involves measuring several key characteristics:
Population Density (D): The number of individuals per unit area.
Population Dispersion: The spatial distribution of individuals within the area.
Ecological Space (Se): The size of the area actually usable by a species.
Ecological Density (De): Population density adjusted to reflect only the suitable habitat available for the species.
Population Dispersion Patterns
Types of Dispersion
Dispersion describes how individuals are distributed across their habitat. There are three main patterns:
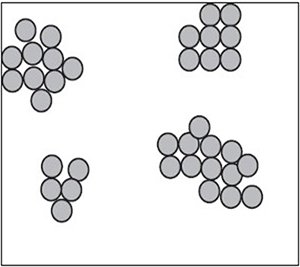
Clumped Dispersion: Individuals group together in patches, often for protection or resource exploitation. Common in animals like pigeons and crows, and in plants reproducing asexually (e.g., grasses).
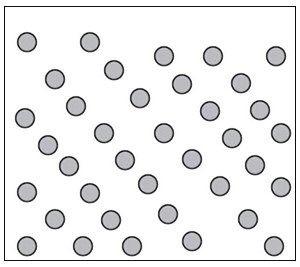
Uniform Dispersion: Individuals are evenly spaced, often due to territorial behavior or competition for resources. Seen in animals guarding territory and plants competing for resources.
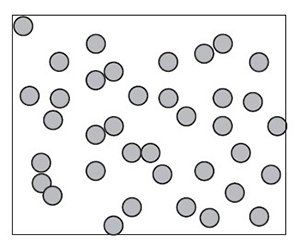
Random Dispersion: Individuals are scattered without a predictable pattern. Occurs when habitat conditions are uniform and individuals are unaffected by each other. Rare in nature, but seen in some rainforest trees and microscopic marine organisms.
Sampling Populations
Quadrat Sampling
Counting every individual in a population is often impractical. Quadrat sampling is used for abundant or immobile organisms (e.g., plants, soil organisms):
Area is mapped and divided into a grid.
Random grid squares are selected for sampling.
A quadrat (usually 1 m2) is placed, and individuals within it are counted.
Counts are repeated and averaged to estimate density.
Formula for average per quadrat:
Population density formula:
Where D is density, N is the number of individuals, and S is the area sampled.
Accuracy pitfalls: Clumped dispersion can skew results; more quadrats improve accuracy.
Mark and Recapture Method
Used for mobile animals (e.g., fish):
Sample of organisms is marked and released.
After a short time, a second sample is taken.
Ratio of marked to unmarked individuals in the second sample estimates population size.
Mark and recapture formula:
Where N is total population, M is number marked initially, n is total in second sample, m is number of marked recaptures.
Pitfalls: Assumes no immigration/emigration, and marking does not affect survival.
Population Growth and Survivorship Curves
Survivorship Patterns
Survivorship curves describe how mortality rates change with age:
Type 1: Few offspring, high probability of surviving to old age. Parents invest heavily in offspring. Examples: Humans, birds, mammals.
Type 2: Constant mortality rate throughout life. Young and old have equal survival chances. Example: Honey bee.
Type 3: High mortality rate when young, declining with age. Many offspring produced, few survive. Examples: Maple trees, sea turtles.
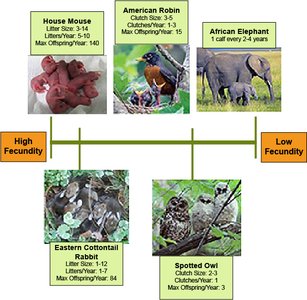
Fecundity and Population Structure
Fecundity is the number of offspring an individual can produce over its lifetime. Type 2 and 3 species typically have high fecundity. Populations with more individuals at reproductive age grow faster.
Example: Mexico's population has a young age structure, leading to growth; Japan's population is older, leading to decline.
Additional info: Survivorship and fecundity are key factors in population dynamics and are used to predict population growth and sustainability.
