Back
BackL17: Population Ecology and Behavioral Ecology: Study Notes
Study Guide - Smart Notes
 Tailored notes based on your materials, expanded with key definitions, examples, and context.
Population Ecology
Introduction to Population Ecology
Population ecology is the study of the factors that affect the size and structure of populations and how these populations change over time. A population is defined as a group of individuals of a single species living in the same general area.
Population size is influenced by births, deaths, immigration, and emigration.
Population size can fluctuate due to both biotic and abiotic factors.

Population Growth Patterns
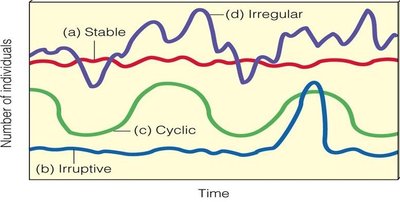
Population size can vary depending on the taxon and environmental conditions. There are several common patterns of population change:
Stable: Population size remains relatively constant over time (birth rates ≈ death rates).
Irruptive: Population size is generally stable but occasionally experiences sudden increases (booms) and decreases (busts).
Cyclic: Population size rises and falls in predictable cycles, often due to predator-prey interactions.
Irregular: Population size changes unpredictably, often due to complex interactions of biotic and abiotic factors.
Density-Dependent and Density-Independent Factors
Population density is the number of individuals per unit area or volume. Factors affecting population density can be classified as:
Density-dependent factors: These factors cause birth and death rates to change as population density changes. Examples include competition for resources, predation, disease, territoriality, intrinsic physiological factors, and accumulation of toxic wastes.
Density-independent factors: These factors affect birth and death rates regardless of population density, such as natural disasters (e.g., fires, floods).
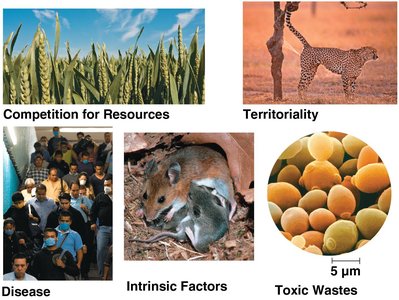
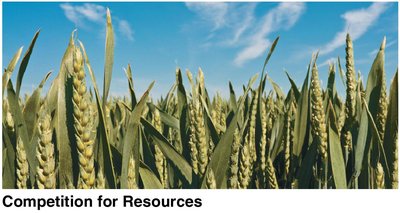
Competition for Resources
High population density increases competition for limited resources, reducing birth rates.
Farmers may apply fertilizers to reduce nutrient limitations and competition among crops.
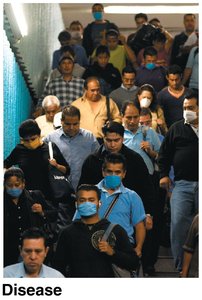
Disease
High population density increases the transmission rate of diseases, leading to higher death rates.
Examples include influenza, COVID-19, and tuberculosis, which spread more rapidly in densely populated areas.
Territoriality
As density increases, individuals compete for space, leading to decreased birth rates and increased death rates.
Some animals, such as cheetahs, use chemical markers to define territories.
Intrinsic Factors
High density can trigger physiological changes that regulate population size, such as hormonal changes that delay sexual maturation or depress the immune system.
Toxic Wastes
Accumulation of toxic metabolic byproducts (e.g., ethanol in yeast) at high densities can reduce birth rates and increase death rates.
Population Cycles and Case Studies
Some populations, such as snowshoe hares and lynx, exhibit regular boom-and-bust cycles. These cycles can be driven by food supply, predation, or a combination of factors.
Experiments show that increasing food supply alone does not eliminate cycles; predation is a key factor.
Exclusion of predators can nearly eliminate population crashes in prey species.
Dispersion Patterns
Dispersion refers to the pattern of spacing among individuals within a population. The main types are:
Clumped: Individuals aggregate in patches, often where resources are abundant.
Uniform: Individuals are evenly spaced, often due to territoriality or competition.
Random: The position of each individual is independent of others, often influenced by abiotic factors.
Survivorship Curves
Survivorship curves plot the proportion or number of individuals in a cohort still alive at each age. There are three main types:
Type I: Low death rates during early and middle life, with a steep increase in death rate in older age (e.g., humans, elephants).
Type II: Constant mortality rate throughout life (e.g., rodents, lizards, some plants).
Type III: High death rates early in life, with survivors experiencing lower death rates later (e.g., oysters, many invertebrates, plants).
Behavioral Ecology
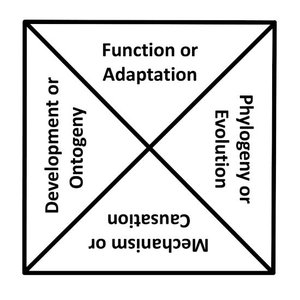
Tinbergen’s Four Questions
Niko Tinbergen developed a framework for understanding animal behavior, known as Tinbergen’s Four Questions:
Mechanism (Causation): What physiological or neurological factors trigger the behavior?
Ontogeny (Development): How does the behavior develop over an individual's lifetime?
Adaptive Value (Function): How does the behavior impact survival and reproductive success?
Phylogeny (Evolution): How did the behavior evolve over species history?
Innate and Learned Behaviors
Innate behaviors: Unlearned, performed the same way by all individuals of a species. Examples include fixed action patterns and escape responses in minnows.
Learned behaviors: Acquired or modified through experience.

Inclusive Fitness and Altruism
Inclusive fitness is the total effect an individual has on proliferating its genes by producing its own offspring and by helping close relatives produce offspring. This concept helps explain altruistic behaviors, where individuals help relatives at a cost to themselves.
Direct fitness: Gained by producing one's own offspring.
Indirect fitness: Gained by helping relatives reproduce.
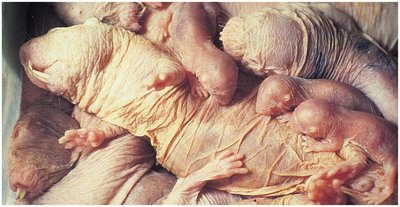
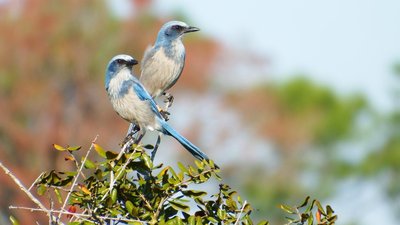
Examples include cooperative breeding in Florida Scrub Jays and eusociality in naked mole rats.