 Back
BackPopulation Ecology and the Distribution of Organisms (Chapter 40) – Study Notes
Study Guide - Smart Notes
 Tailored notes based on your materials, expanded with key definitions, examples, and context.
Population Ecology and the Distribution of Organisms
Introduction to Ecology
Ecology is the scientific study of the interactions between organisms and their environment. Ecologists investigate how these interactions influence the distribution and abundance of organisms, as well as the flow of energy and cycling of nutrients in ecosystems.
Ecology: The study of relationships between living organisms and their physical environment.
Ecological research spans multiple levels, from individual organisms to the entire biosphere.
Key research questions include: What limits the geographic distribution of a species? How do interactions with other species affect population size?
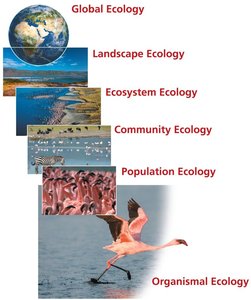
Levels of Ecological Study
Ecological research is organized into a hierarchy of levels, each focusing on different aspects of biological organization:
Organismal Ecology: Examines how an organism’s structure, physiology, and behavior help it survive in its environment.
Population Ecology: Studies factors that affect population size and how populations change over time.
Community Ecology: Investigates interactions between species and how these affect community structure and organization.
Ecosystem Ecology: Focuses on energy flow and chemical cycling among organisms and their environment.
Landscape Ecology: Explores exchanges of energy, materials, and organisms across multiple ecosystems.
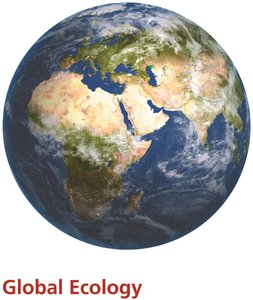
Global Ecology: Examines the biosphere as a whole, considering global patterns and processes.
Climate and the Distribution of Biomes
Climate: Definition and Components
The long-term prevailing weather conditions in an area constitute its climate. Climate is a major determinant of the distribution of organisms and biomes on Earth.
Four major physical components of climate: temperature, precipitation, sunlight, and wind.
Climate can be described at global, regional, and local scales.
Global Climate Patterns
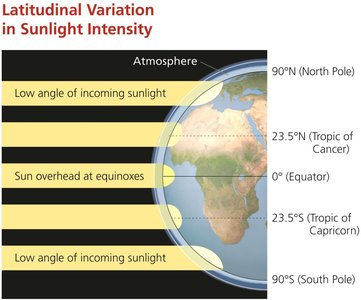
Global climate patterns are determined largely by solar energy and Earth’s movement in space. The sun’s warming effect causes temperature variations, which drive evaporation and the circulation of air and water, resulting in latitudinal variations in climate.
Solar energy input is highest at the equator and decreases toward the poles.
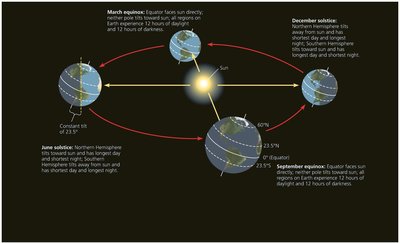
Earth’s tilt and orbit cause seasonal variation in climate.
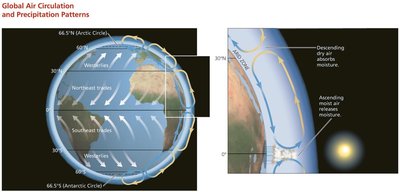
Global Air Circulation and Precipitation Patterns
Warm, wet air rises near the equator, causing precipitation in the tropics.
Dry air descends at 30° north and south, creating deserts.
This pattern repeats at higher latitudes, influencing global distribution of biomes.
Regional and Local Effects on Climate
Seasonality: Caused by Earth’s tilt and orbit, leading to variations in light and temperature with latitude.
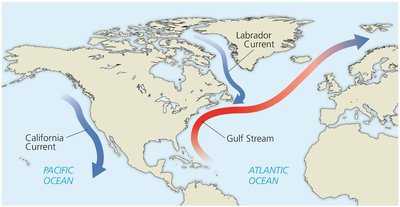
Bodies of Water: Oceans and lakes moderate climate by heating or cooling air masses.
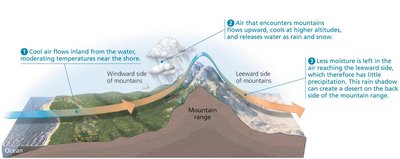
Mountains: Affect sunlight, temperature, and precipitation; create rain shadows and influence biome distribution.
Terrestrial Biomes
Definition and Classification
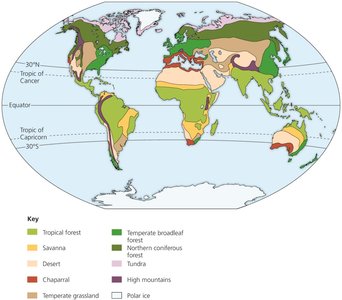
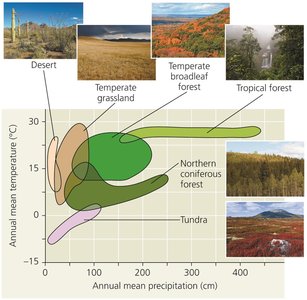
Biomes are major life zones characterized by vegetation type (terrestrial biomes) or physical environment (aquatic biomes). Climate determines the vegetation type and limits the distribution of terrestrial biomes.
Terrestrial biomes are named for their physical or climatic features and predominant vegetation.
Vertical layering (e.g., canopy, understory, ground layer) provides diverse habitats.
Biomes usually grade into each other, forming ecotones (transition areas).
Climographs
A climograph plots the annual mean temperature and precipitation in a region, helping to visualize how climate influences biome distribution.
Biomes are also affected by the pattern of temperature and precipitation throughout the year (e.g., regular vs. seasonal rainfall).
Disturbance and Biome Distribution
Natural and human-caused disturbances (e.g., fires, storms, human activity) can alter the distribution of biomes by removing organisms and changing resource availability.
Disturbances can prevent the establishment of certain vegetation types (e.g., frequent fires prevent savanna from becoming woodland).
Aquatic Biomes
Characteristics and Zonation
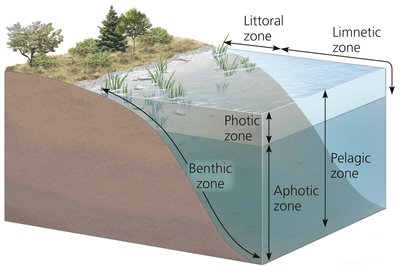
Aquatic biomes are primarily characterized by their physical and chemical environment. They are stratified into vertical and horizontal zones based on light penetration and distance from shore.
Photic zone: Sufficient light for photosynthesis.
Aphotic zone: Little light penetrates.
Pelagic zone: Open water, includes both photic and aphotic zones.
Benthic zone: Bottom substrate; inhabited by benthos (organisms adapted to this environment).
Littoral zone: Shallow, near shore; supports rooted plants.
Limnetic zone: Deeper, open water; too deep for rooted plants.
Thermocline: Temperature boundary separating warm upper water from cold deeper water.
Marine vs. Freshwater Biomes
Marine biomes (e.g., oceans) cover about 75% of Earth’s surface and have a major impact on global climate and wind patterns.
Freshwater biomes (e.g., lakes, rivers) are influenced by their physical and chemical properties and show less latitudinal variation than terrestrial biomes.
Population Ecology: Density, Dispersion, and Demographics
Population Density and Dispersion
Population ecology explores how biotic and abiotic factors influence the density, dispersion, and size of populations.
Population: Group of individuals of the same species living in the same area.
Density: Number of individuals per unit area or volume.
Dispersion: Pattern of spacing among individuals within the population boundaries.
Patterns of Dispersion
Clumped: Individuals aggregate in patches; often due to resource availability or social behavior.
Uniform: Individuals are evenly spaced; may result from territoriality or competition.
Random: Position of each individual is independent of others; occurs where resources are consistent.
Demographics and Life Tables
Demography is the study of the vital statistics of populations and how they change over time, including birth rates, death rates, and migration.
Life table: Age-specific summary of survival and reproductive rates within a population, often constructed by following a cohort (group of individuals of the same age).
Life tables typically focus on females, as they are the reproductive individuals in most species.
Age (years) | Number alive at start of year | Number dying during year | Proportion surviving |
|---|---|---|---|
0 | 1000 | 200 | 0.80 |
1 | 800 | 150 | 0.81 |
2 | 650 | 100 | 0.85 |
3 | 550 | 50 | 0.91 |
4 | 500 | 50 | 0.90 |
5 | 450 | 450 | 0.00 |
Additional info: Table values are illustrative; refer to textbook for actual data.
Survivorship Curves
A survivorship curve graphically represents the number of individuals in a cohort still alive at each age. There are three idealized types:
Type I: High survivorship in early/middle life, steep drop in older age (e.g., humans, large mammals).
Type II: Constant death rate over the lifespan (e.g., some birds, rodents).
Type III: High death rates for young, lower for survivors (e.g., many fish, marine invertebrates).
Reproductive Rates
Reproductive output is measured as the average number of female offspring produced by each female in a given age group.
Age-specific reproductive rates vary among species and influence population growth.
Additional info: These notes are based on Campbell Biology in Focus, 3rd Edition, Chapter 40, and are intended as a concise study guide for college-level General Biology students.
