 Back
BackPopulation Ecology: Factors Affecting Population Size and Dynamics
Study Guide - Smart Notes
 Tailored notes based on your materials, expanded with key definitions, examples, and context.
Population Ecology
Introduction to Population Ecology
Population ecology is the study of the factors that affect the size of populations and how these populations change over time. It is a central field in biology, providing insights into the dynamics of species in their environments and the mechanisms that regulate population growth and decline.
Biotic and Abiotic Factors Affecting Population Density, Dispersion, and Demographics
Population Definition and Boundaries
Population: A group of individuals of a single species living in the same general area.
Boundaries: Can be natural (e.g., lakes, islands) or arbitrarily defined by researchers (e.g., counties).
Density and Dispersion
Density: The number of individuals per unit area or volume (e.g., oak trees per square kilometer).
Dispersion: The pattern of spacing among individuals within the population boundaries.
Estimating Population Density
Direct counts in randomly located plots and extrapolation to the entire area.
Indicators such as nests, burrows, tracks, or fecal droppings.
Mark-recapture method for mobile or elusive species.
Dynamic Nature of Density
Density increases through births and immigration (influx from other areas).
Density decreases through deaths and emigration (movement out of the population).
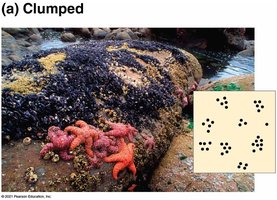
Patterns of Dispersion
The spatial arrangement of individuals within a population provides insight into ecological and behavioral processes.
Clumped Dispersion: Individuals aggregate in patches, often due to resource availability or social behavior.
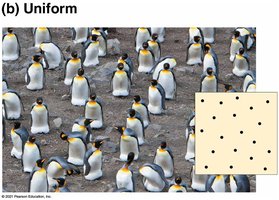
Uniform Dispersion: Individuals are evenly spaced, often due to territoriality or competition.
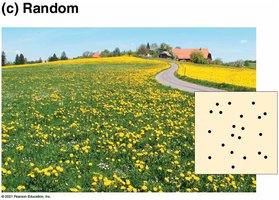
Random Dispersion: The position of each individual is independent of others, occurring in the absence of strong attractions or repulsions.
Demographics
Demography: The study of vital statistics (birth, death, migration rates) and their changes over time.
Life Tables and Survivorship Curves
Life Table: An age-specific summary of survival and reproductive rates, often following a cohort from birth to death.
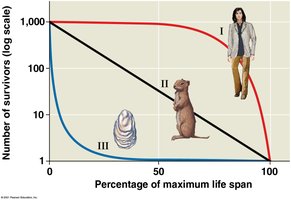
Survivorship Curve: A plot showing the proportion or number of individuals surviving at each age.
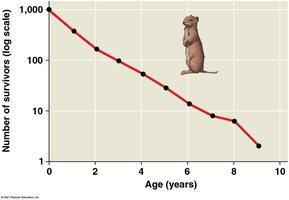
Three general types of survivorship curves:
Type I: Low death rates early and middle life, high death rates in older age (e.g., humans, elephants).
Type II: Constant death rate over the lifespan (e.g., rodents, lizards).
Type III: High death rates for young, lower for survivors (e.g., oysters, many fish, plants).
Reproductive Rates
Measured as the average number of female offspring produced by females in each age group.
Varies widely among species (e.g., squirrels vs. oak trees).
Population Growth Models
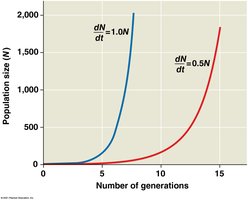
Exponential Growth Model
Describes population growth under ideal, unlimited conditions. The population increases by a constant proportion at each instant.
Equation for change in population size (ignoring immigration and emigration):
Exponential growth equation:
r: Per capita rate of increase.
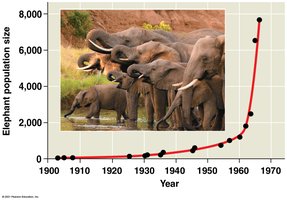
Results in a J-shaped curve when plotted over time.
Characteristic of populations introduced to new environments or rebounding from drastic reductions.
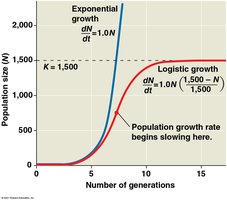
Logistic Growth Model
Incorporates the concept of carrying capacity (K), the maximum population size an environment can sustain. Growth slows as the population approaches K.
Logistic growth equation:
Produces an S-shaped (sigmoid) curve.
Laboratory populations (e.g., Paramecium, Daphnia) often fit the logistic model under controlled conditions.
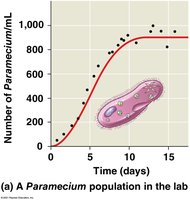
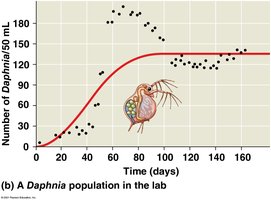
Some populations overshoot K before stabilizing; others fluctuate greatly, making K difficult to define.
Applications: Conservation biology, sustainable harvest rates, extinction risk assessment.
Life History Traits and Natural Selection
Life History Traits
Life history traits are evolutionary outcomes that affect an organism’s schedule of reproduction and survival. They include:
Age at first reproduction (maturity)
How often reproduction occurs
Number of offspring per reproductive episode
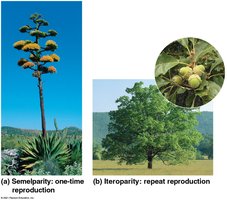
Semelparity: One-time, big-bang reproduction (e.g., agave plant).
Iteroparity: Repeated reproduction throughout life (e.g., oak tree).
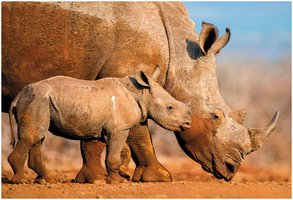
Number of offspring varies widely (e.g., white rhinoceros vs. insects/plants).
Trade-offs in Life Histories
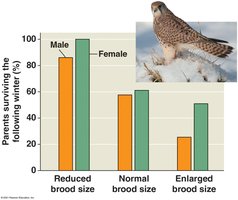
Organisms face trade-offs because resources are limited. Investment in one function (e.g., reproduction) can reduce resources for another (e.g., survival).
Example: Larger brood sizes can reduce parental survival in Eurasian kestrels.
Selective pressures influence the number and size of offspring.
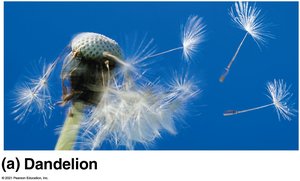
Species with low offspring survival produce many small offspring (e.g., dandelions).
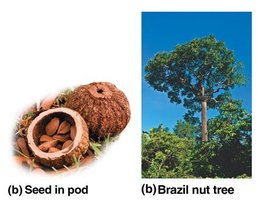
Species with high parental investment produce fewer, larger offspring (e.g., Brazil nut tree).
K-selection: Traits favored at high density, near carrying capacity (few, well-provisioned offspring).
r-selection: Traits favored at low density, maximizing reproductive success (many, small offspring).
Density-Dependent Regulation of Population Growth
Population Regulation
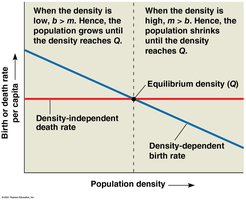
Density-independent factors: Affect birth/death rates regardless of population density (e.g., weather events).
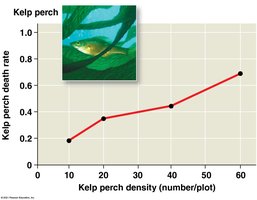
Density-dependent factors: Birth/death rates change with population density, regulating population size via negative feedback.
Example: Kelp perch death rate increases as hiding spaces become scarce at high density.
Mechanisms of Density-Dependent Regulation
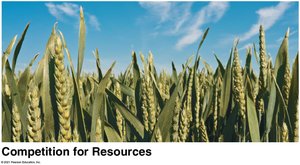
Competition for Resources: Increased density intensifies competition, reducing birth rates.
Disease: Transmission rates increase with density (e.g., influenza in cities).

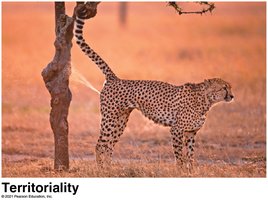
Territoriality: Competition for space limits population size (e.g., cheetahs marking territory).
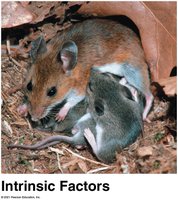
Intrinsic Factors: Physiological changes (e.g., hormonal) can reduce reproduction at high density (e.g., white-footed mice).
Toxic Wastes: Accumulation of waste products can limit population size (e.g., ethanol in yeast cultures).

Population Dynamics
Stability and Fluctuation
Population sizes can fluctuate due to complex interactions between biotic and abiotic factors.
Examples include predator-prey cycles and environmental variability (e.g., moose and wolf populations on Isle Royale).
Immigration and Emigration
Along with births and deaths, immigration and emigration influence population size and structure.
Emigration often increases when populations become crowded and competition intensifies.
