 Back
BackPopulation Ecology, Life Tables, and Food Webs: Step-by-Step Study Guidance
Study Guide - Smart Notes
 Tailored notes based on your materials, expanded with key definitions, examples, and context.
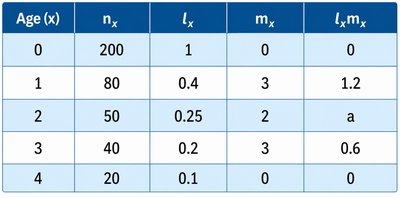
Q27. Use the life table below to answer the questions
Background
Topic: Population Ecology – Life Tables
This question tests your understanding of how to interpret and use life tables to analyze population growth, survivorship patterns, and reproductive output. Life tables are essential tools in ecology for summarizing the survival and reproductive rates of individuals at different ages within a population.
Key Terms and Formulas
nx: Number of individuals surviving to age x
lx: Proportion of the original cohort surviving to age x
mx: Average number of offspring produced by an individual of age x
lxmx: Weighted reproductive output at age x
Key formula:
Net reproductive rate (R0):
Step-by-Step Guidance
a) Calculate the missing value labeled a.
To find the missing value for age 2, use the formula . Plug in the values for age 2: , .
b) Which age class contributes the MOST to population growth?
Look for the age class with the highest value in the table. This value represents the greatest reproductive contribution to the next generation.
c) What type of survivorship curve does this life table most likely represent? (I, II, or III?)
Examine how (survivorship) changes with age. Consider whether most individuals survive to old age (Type I), have a constant death rate (Type II), or experience high mortality early in life (Type III).
d) Add together all the values to find the average lifetime offspring production per individual.
Sum all the values in the table (including the one you calculated in part a) to get .
e) Based on your answer to d), is this population growing, shrinking, or staying the same?
Compare to 1. If , the population is growing; if , it is shrinking; if , it is stable.
Try solving on your own before revealing the answer!
Final Answers:
a)
b) Age class 1 contributes the most ()
c) Type III survivorship curve (high early mortality)
d)
e) The population is growing because
These answers are based on the calculations and interpretation of the life table values.
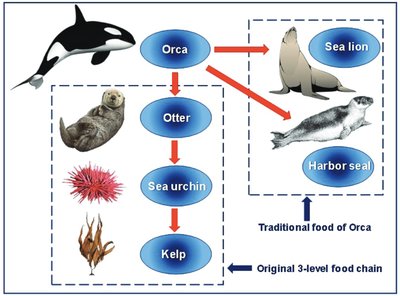
Q29. The graphic below depicts the marine food chain off the Washington/Oregon coast.
Background
Topic: Community Ecology – Food Webs and Trophic Interactions
This question explores the roles of different species in a food web, the concept of keystone species, and the effects of changes at different trophic levels on ecosystem structure and function.
Key Terms and Concepts
Keystone species: A species with a disproportionately large effect on its ecosystem relative to its abundance.
Primary producer: An organism that produces organic compounds from inorganic sources (e.g., plants, algae).
Top-down control: When predators at higher trophic levels regulate the structure and population sizes of lower trophic levels.
Bottom-up control: When resource availability (e.g., nutrients, primary production) regulates ecosystem structure.
Step-by-Step Guidance
a) Over-hunting of sea otters by humans resulted in drastic changes to the ecosystem despite their low overall biomass and abundance. What ecological term best describes this species?
Recall the definition of a keystone species and consider the impact of otters on the food web.
b) Which organism on this graphic is a primary producer?
Identify the organism that forms the base of the food web by converting solar energy into chemical energy.
c) A new pathogen emerges in the coastal system that eradicates kelp. How will the otter population change?
Think about the food chain: kelp → sea urchin → otter. What happens to otters if kelp is removed?
d) The local fisheries decide that seals are eating too many fish and decide to introduce more orcas to hunt the seals. Sardines, an economically essential fish, reside in kelp forests. Based on the graphic, how will this decision impact fishery income?
Consider the indirect effects of increasing orca predation on seals and how this might cascade through the food web to affect sardines and fisheries.
e) Is d) an example of top-down or bottom-up control?
Decide whether the change is initiated by a predator (top-down) or by resource availability (bottom-up).
Try solving on your own before revealing the answer!
Final Answers:
a) Keystone species
b) Kelp
c) Otter population will decline (loss of food source)
d) Fishery income will likely decrease (trophic cascade may reduce sardine habitat)
e) Top-down control
These answers reflect the roles and interactions shown in the food web graphic.
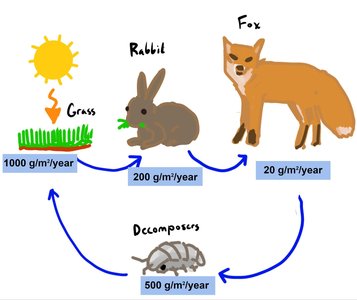
Q30. The graphic below depicts energy and biomass flow through a terrestrial food chain.
Background
Topic: Ecosystem Ecology – Energy Flow and Trophic Levels
This question examines the flow of energy and biomass through different trophic levels, the role of decomposers, and the consequences of changes in the food web.
Key Terms and Concepts
Primary consumer: An organism that eats primary producers (herbivore).
Biomass: The total mass of living matter in a given area or volume.
Trophic level: The position an organism occupies in a food chain.
Decomposer: An organism that breaks down dead organic material, recycling nutrients.
Step-by-Step Guidance
a) Which of the organisms represents the trophic level of primary consumer?
Identify the organism that feeds directly on producers (grass).
b) According to the graphic, which trophic level contains the greatest amount of biomass per surface area?
Compare the biomass values given for each group in the diagram.
c) What process between trophic levels reduces the amount of energy transferred from rabbits to foxes?
Recall the concept of energy loss due to metabolic processes such as respiration, heat loss, and incomplete consumption.
d) If decomposers were removed from this system, what would happen to the cycling of nutrients that support producer growth?
Think about the role of decomposers in breaking down organic matter and recycling nutrients back to the soil for plant uptake.
e) For a carnivore, which of the four groups above would provide the most biomass per unit of land?
Consider which group has the highest biomass and would thus be the most energy-rich food source for a carnivore.
Try solving on your own before revealing the answer!
Final Answers:
a) Rabbit
b) Grass (producers)
c) Respiration/metabolic heat loss
d) Nutrient cycling would slow or stop, reducing producer growth
e) Rabbit (primary consumer)
These answers are based on the energy and biomass values shown in the diagram and the roles of each group in the ecosystem.
