 Back
Population Ecology: Modeling Populations and Life History Strategies
Study Guide - Smart Notes
 Tailored notes based on your materials, expanded with key definitions, examples, and context.
Population Ecology: Modeling Populations and Life History Strategies
Property 1: Dispersal in Population Biology
Dispersal refers to the movement of individuals or propagules (such as seeds) away from their origin or from centers of high population density. It is a critical process in population biology, influencing gene flow, colonization of new habitats, and population dynamics.
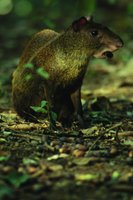
Animal Dispersal: Many animals actively move to new locations, which can affect population structure and genetic diversity.
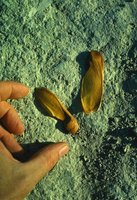
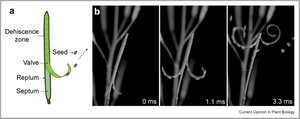
Plant Dispersal: Plants rely on various mechanisms for dispersal, including wind, animals, and explosive mechanisms.
Wind Dispersal: Seeds or spores are carried by the wind to new locations, increasing the range of the species.
Property 2: Dispersion Patterns
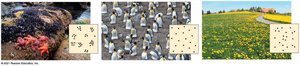
Dispersion describes how individuals in a population are spaced within their area. The mode of dispersal often determines the resulting dispersion pattern.
Clumped: Individuals are aggregated in patches, often due to resource availability or social behavior.
Uniform: Individuals are evenly spaced, often due to territoriality or competition.
Random: The position of each individual is independent of others, often occurring in homogeneous environments.
Factors Influencing Dispersion: Habitat heterogeneity, resource distribution, behavioral interactions, and dispersal limitations.
Property 3: Cohorts and Survivorship Curves
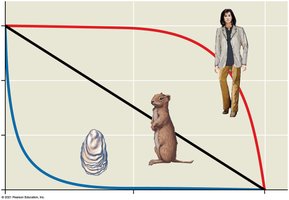
A cohort is a group of individuals of the same age, tracked over time to study survival patterns. Survivorship curves graphically represent the number of individuals surviving at each age for a given cohort.
Survivorship Curves: Used to analyze mortality patterns and predict population trends. Common in ecological and medical studies.
Property 4: Life History Strategies and Survivorship
Life history strategy describes how an organism allocates resources to growth, reproduction, and survival to maximize fitness. Survivorship is a key component of this strategy.
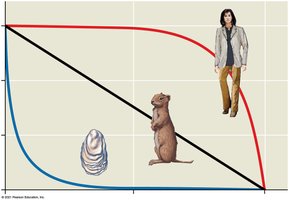
Type I Curve: High survivorship until old age (e.g., humans).
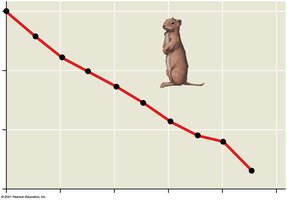
Type II Curve: Constant mortality rate throughout life (e.g., some rodents).
Type III Curve: High mortality early in life, with survivors living long (e.g., oysters, many plants).
Property 5: Reproductive Strategies
Reproductive strategies are shaped by evolutionary pressures and are a major aspect of life history. The two main strategies are:
Semelparity: Organisms reproduce once and then die (e.g., some plants like agave).
Iteroparity: Organisms reproduce multiple times over their lifespan (e.g., most mammals and perennial plants).
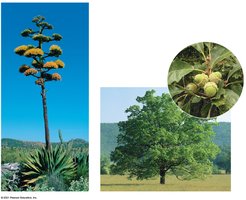
Most semelparous organisms have type III survivorship curves, but exceptions exist.
Property 6: Age Structure
Age structure refers to the distribution of individuals among different ages in a population. It is crucial for predicting future population growth and understanding demographic trends.
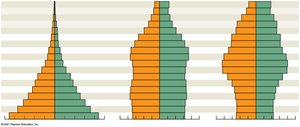
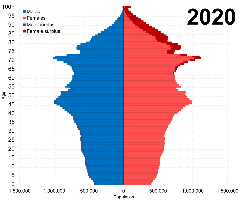
Population Pyramids: Graphical representations of age structure, showing the proportion of individuals in each age group for males and females.
Growth Patterns: Rapid growth (broad base), slow growth (more even distribution), and no growth (narrow base or top-heavy).
Population Dynamics: The Four Vital Rates
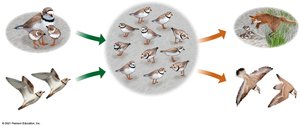
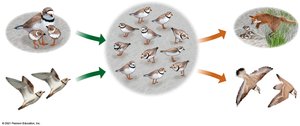
Population size changes due to four vital rates: births, deaths, immigration, and emigration. These are the only direct factors influencing population size.
Births (B): Increase population size.
Deaths (D): Decrease population size.
Immigration (I): Individuals entering the population.
Emigration (E): Individuals leaving the population.
Population Growth Models
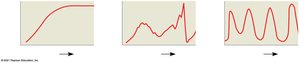
Population growth can be modeled mathematically using the four vital rates. The way these rates change over time determines population trends, which may be stable, fluctuate, or cycle.
Discrete Population Growth Model
For populations with non-overlapping generations, the discrete growth model is used:
Let be the population size at time .
The equation:
Growth rate is calculated as , so
Exponential Growth Model
In the absence of limiting factors, populations can grow exponentially:
Continuous model:
is the intrinsic (per capita) growth rate.
Assumes unlimited resources and no immigration/emigration.
Logistic Growth Model
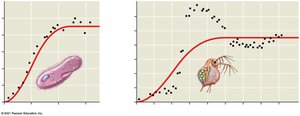
In nature, resources are limited, leading to logistic growth:
Logistic equation:
is the carrying capacity, or the maximum population size the environment can support.
When is small, growth is nearly exponential; as approaches , growth slows and stabilizes.
The logistic term reduces growth as population size increases.
Comparison of Exponential and Logistic Growth
Exponential growth occurs when resources are unlimited.
Logistic growth incorporates environmental limits, resulting in an S-shaped curve.
Additional info: These models are foundational in ecology for predicting population trends, managing wildlife, and understanding the effects of environmental changes on species.
