 Back
BackPopulation Ecology: Principles, Patterns, and Human Impact
Study Guide - Smart Notes
 Tailored notes based on your materials, expanded with key definitions, examples, and context.
Population Ecology
Population Size and Density
Population ecology studies the dynamics of species populations and how these populations interact with the environment. Population size refers to the total number of individuals in a population, while population density is the number of individuals per unit area or volume.
Population Size (N): The total number of individuals in a population at a given time.
Population Density: The number of individuals per unit area (e.g., per square kilometer).
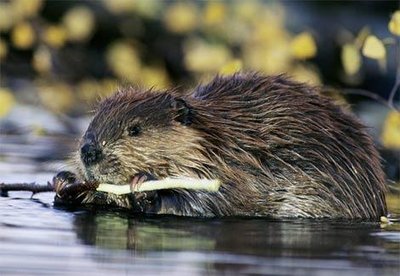
Example Calculation: If a beaver population has 50 births (B), 25 deaths (D) over 5 years (T), and an initial population (N) of 125, the population size can be tracked over time using the formula:
Dispersion Patterns
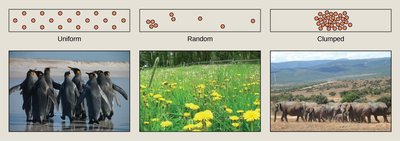
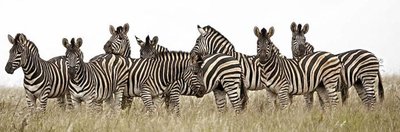
Dispersion describes how individuals in a population are spaced within an area. There are three main patterns:
Uniform: Individuals are evenly spaced, often due to territorial behavior or competition.
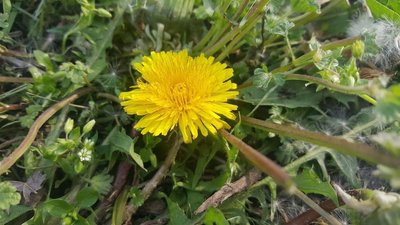
Random: Individuals are spread without a predictable pattern, often seen in plants with wind-dispersed seeds.
Clumped: Individuals are grouped in patches, often due to resource availability or social behavior.
Life History and Survivorship
Life History Strategies
Life history traits influence how populations grow and persist. Two main strategies are:
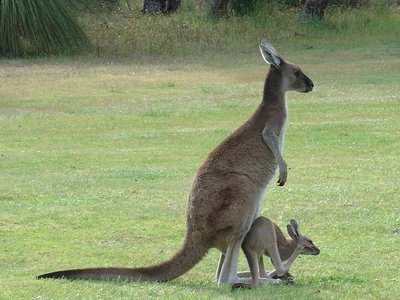
K-selected species: Live in stable environments, have fewer offspring, provide parental care, and have long lifespans (e.g., kangaroos).
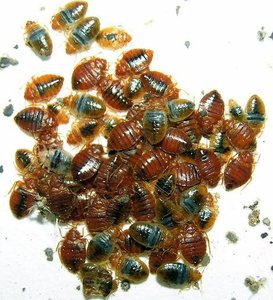
R-selected species: Live in unstable environments, produce many offspring with little parental care, and have short lifespans (e.g., bed bugs).
Survivorship Curves
Survivorship curves show the probability of individuals surviving to a particular age. There are three types:
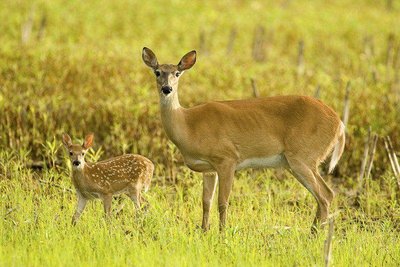
Type I (Late loss): High survivorship until old age (e.g., humans, deer).
Type II (Constant loss): Constant death rate at all ages (e.g., some birds).
Type III (Early loss): High mortality early in life, with survivors living long (e.g., many insects, plants).
Mortality Rate
The mortality rate is the probability of an individual dying within a certain period. It is calculated as:
Example: If 12 deer die out of 776 remaining, the mortality rate is approximately 15 per 1000 individuals.
Population Growth and Limiting Factors
Factors Limiting Population Growth
Population growth is limited by both biotic and abiotic factors:
Competition: For food, water, space, oxygen, and mates.
Interspecific competition: Between different species.
Intraspecific competition: Within the same species.
Limiting factors: Any factor that causes population growth to decrease.
Density-Dependent and Density-Independent Factors
Density-dependent factors: Effects increase with population density (e.g., competition, predation, disease).
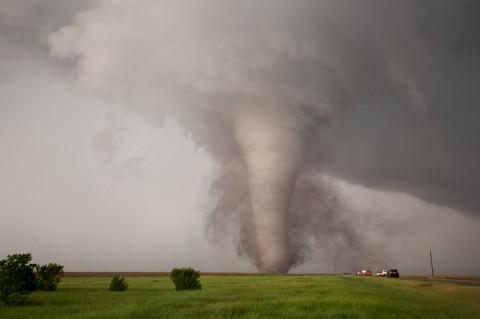
Density-independent factors: Effects are unrelated to population density (e.g., weather, natural disasters, human activities).
Carrying Capacity
Carrying capacity (K) is the maximum population size that an environment can support indefinitely. It is determined by resource availability such as food, water, and space.
Example: In a lifeboat, the carrying capacity is the number of people who can survive given limited resources.
Example: If a fox population's food supply decreases, the carrying capacity for foxes also decreases.
Population Growth Models
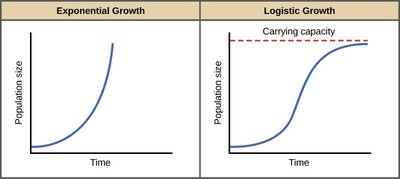
Exponential Growth
Exponential growth occurs when resources are unlimited, and the population increases at a constant rate, producing a J-shaped curve.
Equation:
Where: = population at time t, = initial population, = growth rate, = time
Logistic Growth
Logistic growth occurs when resources become limited, slowing population growth as it approaches carrying capacity, producing an S-shaped curve.
Equation:
Where: = carrying capacity
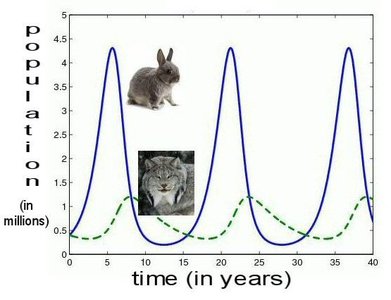
Predator-Prey Relationships
Predators help regulate prey populations. As prey numbers rise, predator numbers also increase, and vice versa. This dynamic can lead to population cycles.
Measuring Populations
Sampling Methods
Random Sampling (Quadrat Method): Used for non-mobile organisms like plants. A quadrat is a marked-off area where individuals are counted to estimate population size.

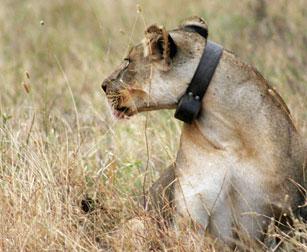
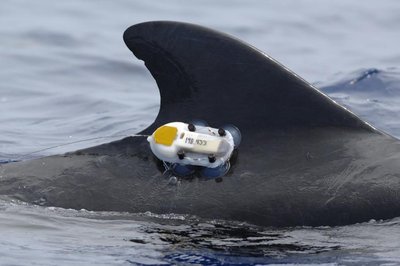
Mark and Recapture: Used for mobile organisms. Animals are captured, marked, released, and then recaptured to estimate population size using the Lincoln-Petersen Index:
Where: M = number marked in first sample C = total caught in second sample R = number of marked recaptures
Demography and Human Population Growth
Demography
Demography is the statistical study of population dynamics, including birth rates, death rates, age structure, and growth rates.
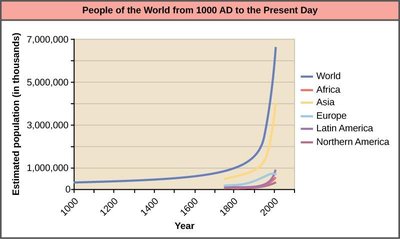
Human Population Growth
Positive growth rate: Population increases.
Negative growth rate: Population decreases.
Zero population growth: Birth rate equals death rate; population is stable.

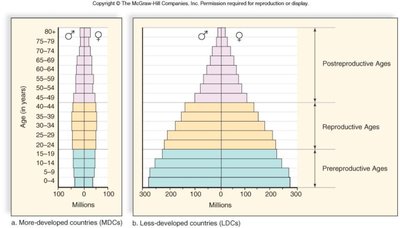
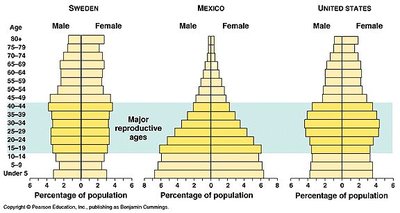
Age Structure Diagrams
Age structure diagrams show the percentage of people in different age groups within a population. They help predict future population growth and economic needs.
Population Policies and Growth Control
Zero Population Growth: Some countries implement policies to stabilize or reduce population growth (e.g., China's One Child Policy, Russia's Day of Conception).
