 Back
BackPopulation Ecology: Principles, Patterns, and Regulation
Study Guide - Smart Notes
 Tailored notes based on your materials, expanded with key definitions, examples, and context.
Population Ecology
Definition of a Population
A population is a group of individuals of the same species that live in a specific geographic area and interbreed. Understanding populations is fundamental to ecology, as it allows scientists to study how organisms interact with their environment and each other.
Population Size and Growth
Population size (N) refers to the total number of individuals in a population. The growth of a population depends on several factors:
Birth rate (B): Number of individuals born per unit time.
Death rate (D): Number of individuals dying per unit time.
Immigration: Individuals entering the population.
Emigration: Individuals leaving the population.
The population growth rate (R) can be calculated as:
Population growth over time (T) is:
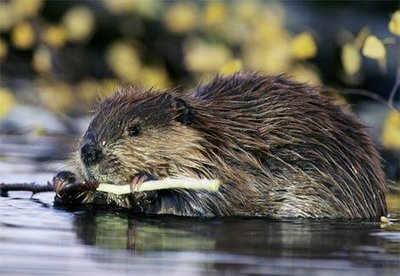
Example: If a beaver population has 50 births and 25 deaths over 5 years, with an initial population of 125, the growth rate can be calculated using the above formulas.
Population Density
Population density is the number of individuals per unit area or volume. It provides insight into how crowded a population is and can influence interactions such as competition and disease transmission.
Dispersion Patterns
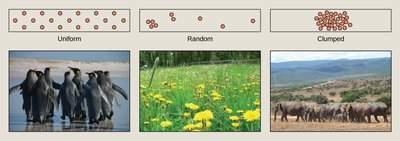
Dispersion describes how individuals in a population are spaced within an area. The three main patterns are:
Uniform: Individuals are evenly spaced (often due to territorial behavior).
Random: Individuals are spread unpredictably (rare in nature).
Clumped: Individuals are grouped in patches (common, often due to resource availability).
Life History and Mortality
Life history divides a population into age groups and sometimes sexes, showing how long members are likely to live. Mortality rate is the probability of an individual dying within a certain period, often expressed per 1,000 individuals:
Example: If 12 deer die out of 776 remaining from an original population of 1,000, the mortality rate is approximately 15 per 1,000 individuals.
K-selected vs. R-selected Species
Species can be classified based on their reproductive strategies:
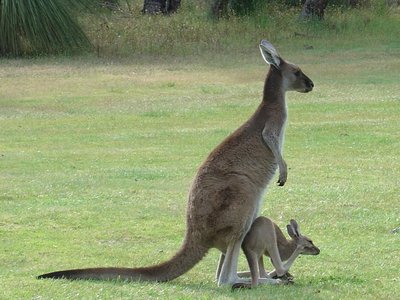
K-selected species: Live in stable environments, have fewer offspring, provide parental care, and have long life spans.
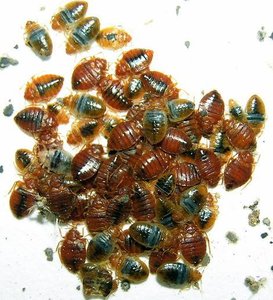
R-selected species: Live in unstable environments, produce many offspring (most of which do not survive), and have short life spans.
Survivorship Curves
Survivorship curves graph the number of individuals surviving at each age. There are three main types:
Type I (late loss): High survival in early/middle life, most mortality at old age (e.g., humans, large mammals).
Type II (constant loss): Constant mortality rate throughout life (e.g., some birds, rodents).
Type III (early loss): High mortality early in life, survivors live long (e.g., many fish, invertebrates).
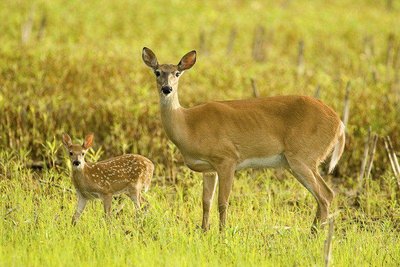
Example: Deer in Indiana are likely to have a Type I or II survivorship curve, reflecting moderate to high survival rates through much of life.
Limiting Factors and Competition
Population growth is limited by resources such as food, water, space, oxygen, and mates. Competition can be:
Interspecific: Between different species.
Intraspecific: Within the same species.
Any biotic or abiotic factor that causes population growth to decrease is called a limiting factor.
Density-Dependent and Density-Independent Factors
Limiting factors can be classified as:
Density-Dependent Factors | Density-Independent Factors |
|---|---|
Competition | Unusual weather |
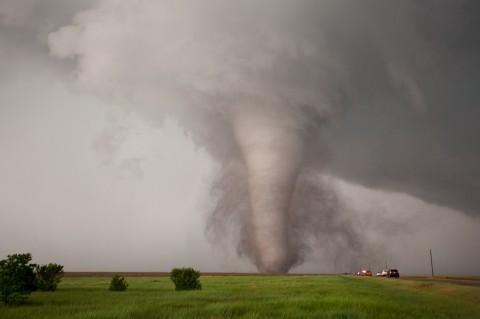
Predation | Natural disasters |
Disease | Human activities |
Depend on population size | Do not depend on population size |
Carrying Capacity
Carrying capacity (K) is the maximum number of individuals an environment can support sustainably. It is determined by the availability of resources such as food, water, and space.
Example: In a lifeboat, the carrying capacity is the number of people who can survive given the available resources. For a fox population, if rabbit numbers decrease due to hunting, the carrying capacity for foxes also decreases, demonstrating the effect of limiting factors.
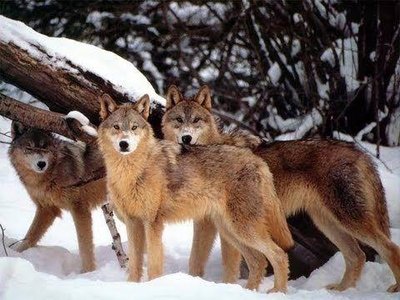
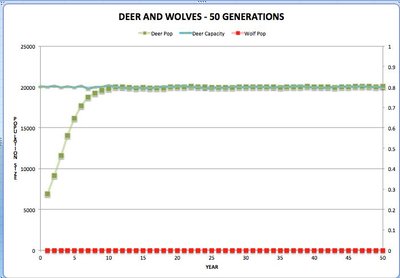
Additional info: The graph illustrates how populations fluctuate around carrying capacity, with predator-prey interactions (e.g., deer and wolves) influencing population stability.
