 Back
BackPopulation Ecology: Structure, Dynamics, and Growth
Study Guide - Smart Notes
 Tailored notes based on your materials, expanded with key definitions, examples, and context.
Population Ecology
Introduction to Population Ecology
Population ecology is the study of populations in relation to their environment, including environmental influences on population density and distribution, age structure, and variations in population size. A population is a group of individuals of the same species living in the same area, interacting, relying on the same resources, and interbreeding.
Population: Group of individuals of the same species in a defined area.
Community: All populations of different species in an area.
Ecosystem: The community plus the abiotic environment.
Biosphere: The global sum of all ecosystems.
Characterizing Populations
Population Range, Dispersion, and Density
Populations are described by their geographic range, dispersion patterns, and size/density. These characteristics provide insight into the environmental associations and social interactions of individuals in a population.
Range: The geographic area occupied by a population.
Dispersion Pattern: The spatial arrangement of individuals within the population.
Size/Density: The number of individuals per unit area or volume.
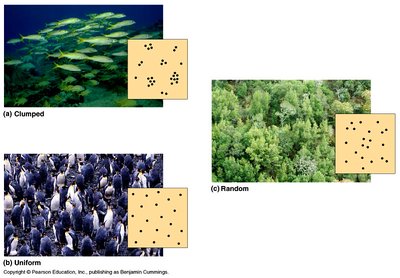
Dispersion Patterns
Clumped: Individuals aggregate in patches, often due to resource availability or social behavior.
Uniform: Individuals are evenly spaced, often due to territoriality or competition.
Random: The position of each individual is independent of others, often occurring in homogeneous environments.
Dispersion patterns are influenced by behaviors such as swarming, marking territory, and competition for resources.
Factors Affecting Population Growth
Density-Dependent and Density-Independent Factors
Population growth is regulated by both biotic and abiotic factors, which can be density-dependent or density-independent.
Density-Dependent Factors: Effects increase as population density increases (e.g., competition for food, mates, nesting sites; predation; parasitism; disease).
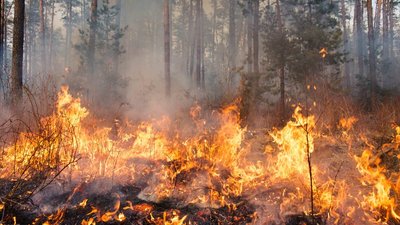
Density-Independent Factors: Effects are unrelated to population density (e.g., sunlight, temperature, rainfall, weather events, human activities).
Measuring Population Size
Population Change: Births, Deaths, Immigration, and Emigration
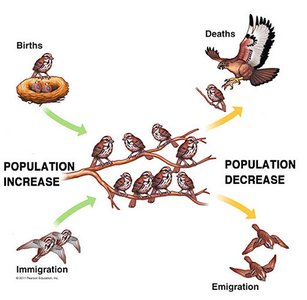
Population size changes due to four main processes: births, deaths, immigration (movement into a population), and emigration (movement out of a population).
Births and Immigration: Increase population size.
Deaths and Emigration: Decrease population size.
Population Characteristics Affecting Size
Sex Ratio, Generation Time, Age Structure, and Survivorship
Several characteristics influence population growth and structure:
Sex Ratio: The proportion of males to females; affects reproductive potential.
Generation Time: The average time between the birth of individuals and the birth of their offspring.
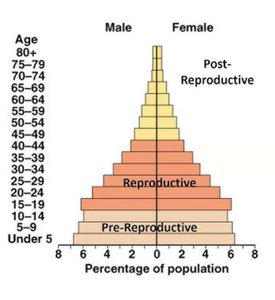
Age Structure: The distribution of individuals among different ages; especially the number of females at reproductive age.
Survivorship: The number of individuals surviving at each age.
Reproductive Strategies: The time and energy invested in reproduction and care for offspring.
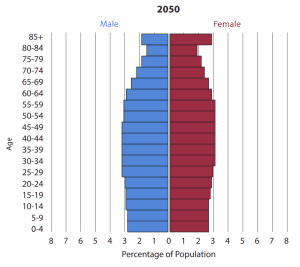
Age Structure Graphs
Age structure diagrams predict population growth rates by showing the proportion of individuals in different age groups.
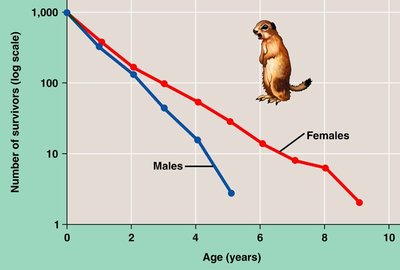
Survivorship Curves
Types of Survivorship Curves
Survivorship curves show the number of individuals surviving at each age group, reflecting different life history strategies:
Type I: Low mortality in early and middle life, high mortality in older age (e.g., humans).
Type II: Constant mortality rate throughout life span (e.g., some rodents, hydra).
Type III: High mortality in early life, with survivors living long (e.g., oysters, many fish).
Reproductive Strategies
K-Selected vs. r-Selected Species
Species adopt different reproductive strategies based on environmental conditions:
K-Selected Species: Late reproduction, few offspring, high parental investment. Adapted to stable environments near carrying capacity.
r-Selected Species: Early reproduction, many offspring, little parental care. Adapted to unpredictable or changing environments.
Trade-offs exist between survival and reproduction, such as energy spent on foraging, defense, or mating displays.
Trade-Off Examples
Birds investing heavily in many offspring may reduce their own survival.
Fish in high predation areas may reproduce earlier but at smaller sizes.
Some insects prioritize reproduction over survival.
Population Growth Models
Exponential and Logistic Growth
Population growth can be modeled mathematically:
Exponential Growth: Rapid, unrestricted growth; occurs when resources are unlimited and population is small.
Logistic Growth: Growth slows as population approaches carrying capacity (K), the maximum population size the environment can support.
Exponential growth produces a "J-shaped" curve, while logistic growth produces an "S-shaped" curve.
Key Equations
Population Change:
Exponential Growth: where = population size, = maximum per capita growth rate, = time
Logistic Growth: where = carrying capacity
Human Population Growth
Trends and Carrying Capacity
Human population growth has been exponential, especially since the Industrial Revolution, due to advances in medicine, technology, and agriculture. The carrying capacity of Earth for humans is debated and depends on resource use and technology.
World population (2023): ~8 billion
Projected (2050): ~9.8 billion
Growth rates vary by region and are influenced by factors such as disease, resource availability, and social changes.
Population Cycles and Regulation
Predator-Prey Interactions and Feedback
Some populations exhibit regular cycles due to predator-prey interactions. Negative feedback mechanisms stabilize populations by linking the growth of one population to changes in another.
Summary Table: Population Growth Factors
Factor | Type | Examples |
|---|---|---|
Competition | Density-dependent | Food, mates, nesting sites |
Predation | Density-dependent | Predators, parasites, pathogens |
Abiotic Factors | Density-independent | Sunlight, temperature, rainfall, weather |
Human Impact | Density-independent | Habitat destruction, pollution |
Additional info: Population ecology integrates mathematical models, field observations, and experimental studies to understand how populations change over time and what factors regulate their size and structure.
