 Back
Population Ecology: Structure, Dynamics, and Growth
Study Guide - Smart Notes
 Tailored notes based on your materials, expanded with key definitions, examples, and context.
Population Ecology
Introduction to Population Ecology
Population ecology is the study of populations in relation to their environment, focusing on how biotic and abiotic factors influence the density, distribution, size, and age structure of populations. This field is essential for understanding how populations interact with their surroundings and the factors that regulate their growth and survival.
Population ecology examines the relationships between organisms and their environment at the population level.
Key questions include how environmental factors affect population density, distribution (dispersion), size, and age structure.
Key Definitions in Population Ecology
Population and Population Growth
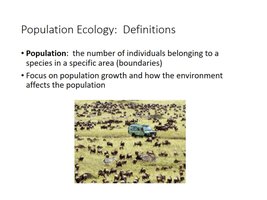
A population is defined as the number of individuals belonging to a species in a specific area with defined boundaries. Population ecology focuses on how populations grow and how environmental factors affect this growth.
Population: The number of individuals of a species in a defined area.
Population growth and environmental influences are central topics.
Population Density and Size
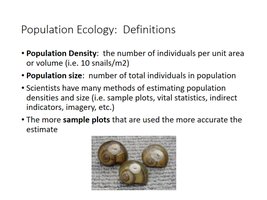
Population density refers to the number of individuals per unit area or volume (e.g., 10 snails/m2). Population size is the total number of individuals in the population. Scientists estimate these values using various methods, such as sample plots and indirect indicators. The accuracy of estimates increases with the number of sample plots used.
Population density: Number of individuals per unit area or volume.
Population size: Total number of individuals in the population.
Estimation methods include sample plots, vital statistics, and indirect indicators.
More sample plots yield more accurate estimates.
Population Measurement Techniques
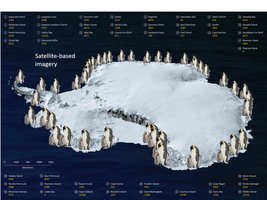
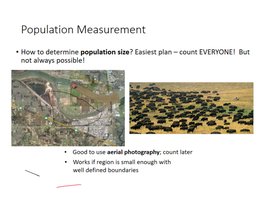
Determining population size can be straightforward if the region is small and boundaries are well defined, allowing for a complete count. In larger or less accessible areas, aerial photography and satellite imagery are useful tools for estimating population size.
Direct counting is feasible in small, well-bounded regions.
Aerial photography and satellite imagery are valuable for large or remote populations.
Population Dynamics
Factors Affecting Population Size
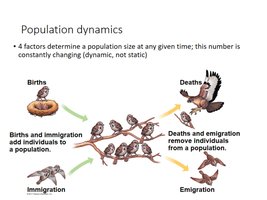
Population size is dynamic and changes over time due to four main factors: births, deaths, immigration, and emigration. Births and immigration add individuals to a population, while deaths and emigration remove individuals.
Births and immigration increase population size.
Deaths and emigration decrease population size.
Patterns of Density and Dispersion
Population Structure and Dispersion Patterns
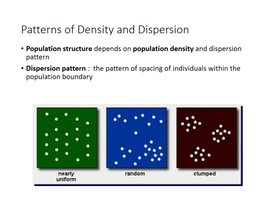
Population structure is determined by population density and the pattern of dispersion, which describes how individuals are spaced within the population boundary. The three main dispersion patterns are nearly uniform, random, and clumped.
Dispersion pattern: The spatial arrangement of individuals within a population.
Types: Uniform (even spacing), random (unpredictable spacing), clumped (individuals grouped in patches).
Examples of Dispersion Patterns
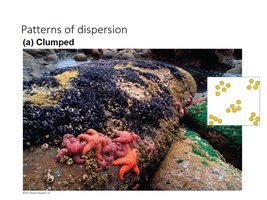
Clumped dispersion: Individuals aggregate in patches, often due to resource availability or social behavior.
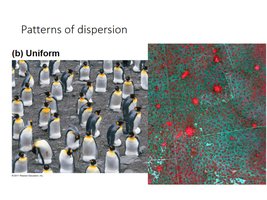
Uniform dispersion: Individuals are evenly spaced, often due to territorial behavior or competition.
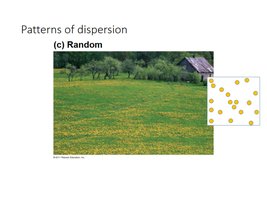
Random dispersion: The position of each individual is independent of others, often occurring in habitats with uniform resources.
Demography and Life Tables
Demography
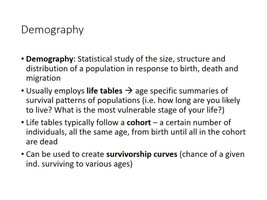
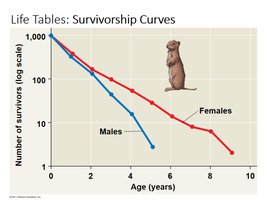
Demography is the statistical study of the size, structure, and distribution of populations in response to birth, death, and migration. Demographers use life tables to summarize age-specific survival patterns and to identify vulnerable life stages. Life tables typically follow a cohort (a group of individuals of the same age) and can be used to create survivorship curves, which show the probability of surviving to various ages.
Life tables provide age-specific survival data.
Survivorship curves visualize the likelihood of survival at different ages.
Life Table Example
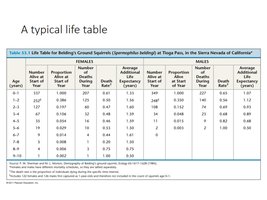
A typical life table includes columns for age, number alive at start of year, proportion surviving, number dying, death rate, and life expectancy for both males and females. This allows for detailed demographic analysis.
Age (years) | Number Alive at Start | Proportion Alive | Number Dying | Death Rate | Life Expectancy |
|---|---|---|---|---|---|
0 | 157 | 1.00 | 37 | 0.24 | 2.1 |
1 | 120 | 0.76 | 19 | 0.16 | 2.2 |
2 | 101 | 0.64 | 15 | 0.15 | 2.3 |
... | ... | ... | ... | ... | ... |
Survivorship Curves
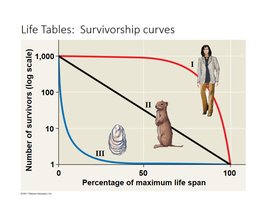
Survivorship curves graphically represent the number of individuals surviving at each age. They are useful for comparing survival patterns between sexes or species.
Type I: High survival in early/middle life, rapid decline in later life (e.g., humans).
Type II: Constant death rate over the lifespan (e.g., some rodents).
Type III: High mortality early in life, survivors live long (e.g., oysters).
Population Growth Models
Exponential Growth Model
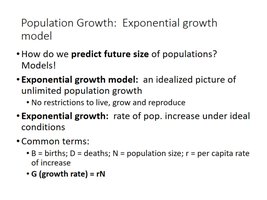
The exponential growth model describes idealized, unlimited population growth where resources are not limiting. The rate of population increase under ideal conditions is called exponential growth. The model is represented by the equation:
B = births, D = deaths, N = population size, r = per capita rate of increase
Equation:
Example of Exponential Growth
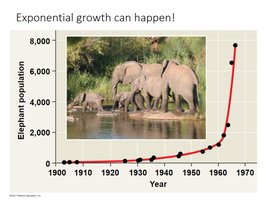
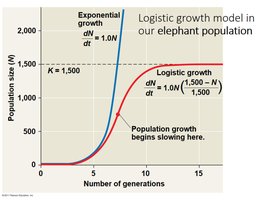
Exponential growth can occur in populations with abundant resources and minimal environmental resistance, as illustrated by the rapid increase in elephant populations under protection.
Logistic Growth Model
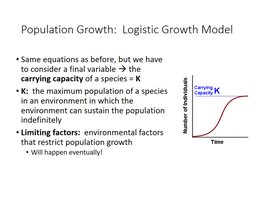
The logistic growth model incorporates environmental limits, describing population growth that slows as the population approaches the carrying capacity (K) of the environment. The carrying capacity is the maximum population size that the environment can sustain indefinitely. The logistic growth equation is:
Limiting factors restrict population growth as resources become scarce.
Logistic Growth in Elephants
As the population size approaches the carrying capacity, growth slows and stabilizes. This is evident in elephant populations where environmental limits are reached.
Population Growth and Reproduction
Effects of Reproduction on Population
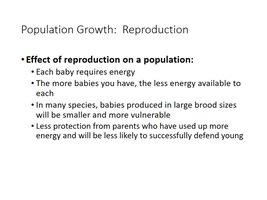
Reproduction affects population growth by influencing the number and survival of offspring. Each offspring requires energy, and producing more offspring can reduce the energy available to each, making them smaller and more vulnerable. Parental investment also affects offspring survival.
Trade-off between number of offspring and parental care.
Large broods may result in less protection and lower survival rates.
Reproductive Strategies: r- and K-selection
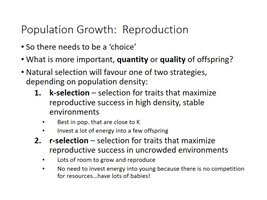
Natural selection favors different reproductive strategies depending on population density and environmental conditions:
K-selection: Traits that maximize reproductive success in high-density, stable environments (few offspring, high parental care).
r-selection: Traits that maximize reproductive success in uncrowded environments (many offspring, low parental care).
Population Growth: Boom and Bust Cycles
Boom and Bust Dynamics
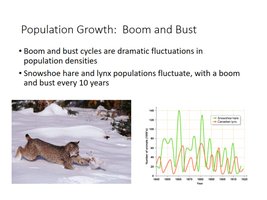
Boom and bust cycles are dramatic fluctuations in population densities, often seen in predator-prey relationships. For example, snowshoe hare and lynx populations exhibit regular cycles of rapid growth (boom) followed by sharp declines (bust) every ten years.
Additional info: Population ecology integrates concepts from demography, statistics, and evolutionary biology to understand how populations change over time and space. These principles are foundational for conservation biology, wildlife management, and understanding human impacts on ecosystems.
