 Back
Population Ecology: Structure, Dynamics, and Growth Models
Study Guide - Smart Notes
 Tailored notes based on your materials, expanded with key definitions, examples, and context.
Population Ecology
Definition and Importance of Populations
Population ecology is the study of groups of individuals of the same species living in a defined area, focusing on the factors that affect their size and how these change over time. Populations are the smallest units of evolution and are often defined by boundaries, shared environments, and the potential for interbreeding.
Population: A group of individuals of a single species living in the same general area.
Populations experience similar environmental conditions and can interbreed.
Population boundaries may be natural or artificial.
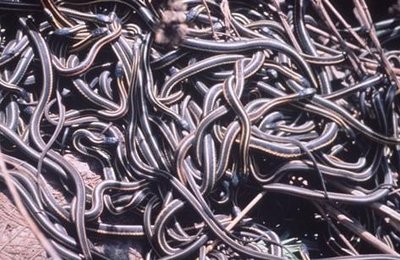
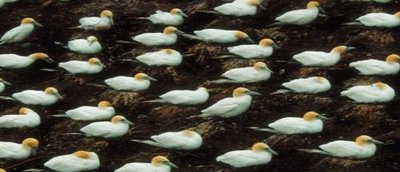
Population Ecology: Scope and Key Questions
Population ecology investigates the factors that influence population size and how these factors cause populations to fluctuate over time. The field is structured around three main characteristics, known as the 3Ds of population ecology: Density, Dispersion, and Demographics.
Density: Number of individuals per unit area or volume.
Dispersion: Pattern of spacing among individuals within a population.
Demographics: Study of how population characteristics (such as age structure and birth/death rates) change over time.
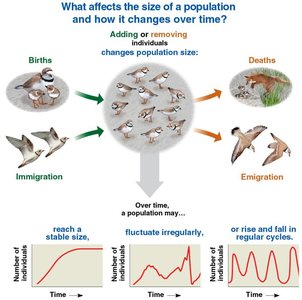
3Ds of Population Ecology
Density
Density is a measure of how many individuals occupy a given area or volume. It is a fundamental property for understanding population structure and dynamics.
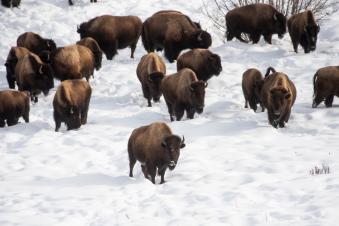
Direct counts are possible for large, conspicuous species in limited areas (e.g., bison in Yellowstone).
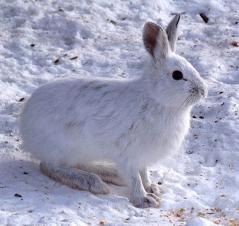
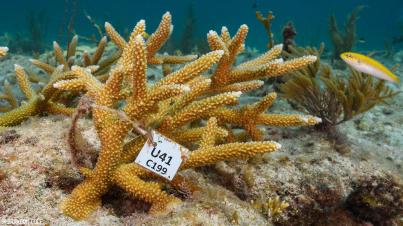
For smaller or widely distributed species, ecologists use sampling, mark-recapture methods, or indirect indicators (nests, tracks, feces).
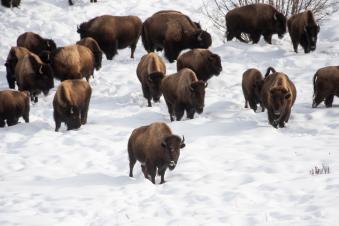
Methods for Measuring Density
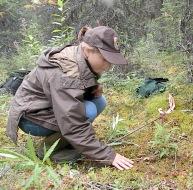
Direct Count: Counting every individual (feasible for small populations or large organisms).
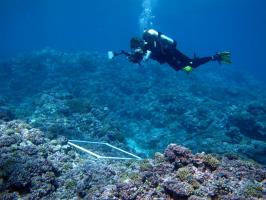
Sampling: Counting individuals in randomly selected plots and extrapolating to the whole area.
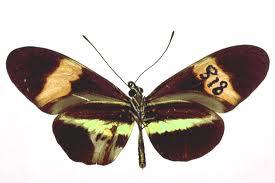
Mark-Recapture: Marking a subset of individuals, releasing them, and then recapturing to estimate total population size.
Indirect Indicators: Counting nests, burrows, tracks, or feces as proxies for population size.
Mark-Recapture Method
The mark-recapture method estimates population size using the formula:
Assumptions: Marked and unmarked individuals have equal capture probability, marked individuals remix into the population, and no births, deaths, immigration, or emigration occur between samplings.
Population Size Estimate:
Dispersion
Dispersion describes the spatial arrangement of individuals within a population. It provides insight into ecological processes and interactions.
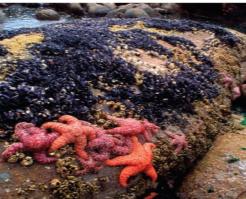
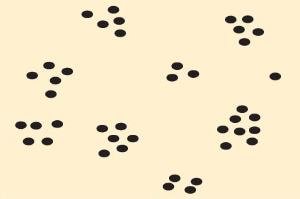
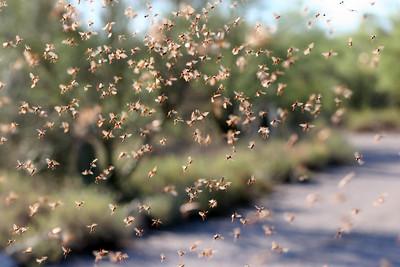
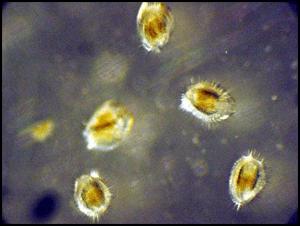
Clumped: Individuals aggregate in patches, often where resources are abundant or conditions are favorable.
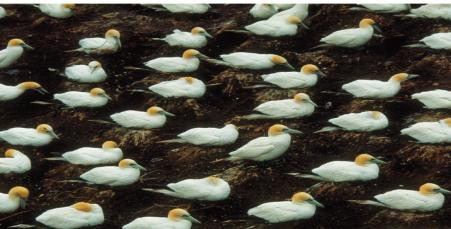
Uniform: Individuals are evenly spaced, often due to territoriality or competition.
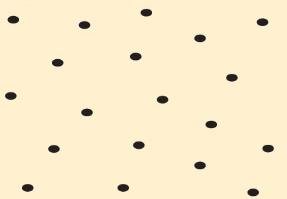
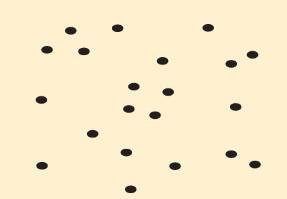
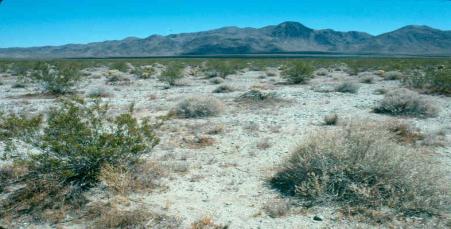
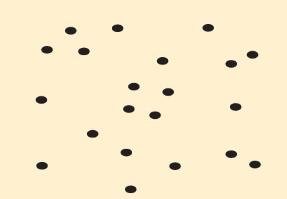
Random: Position of each individual is independent of others, usually where resources are evenly distributed.
Clumped Dispersion
Most common pattern in nature.
Individuals aggregate in areas of high resource availability, mating opportunities, or for predator avoidance.
Uniform Dispersion
Less common than clumped.
Results from direct interactions such as territoriality or allelopathy (chemical competition).
Random Dispersion
Least common pattern.
Occurs where resources are consistently available and there are no strong interactions among individuals.
Demographics
Demographics study how population characteristics such as age structure, birth rates, and death rates change over time. This includes the analysis of vital statistics and their influence on population growth and decline.
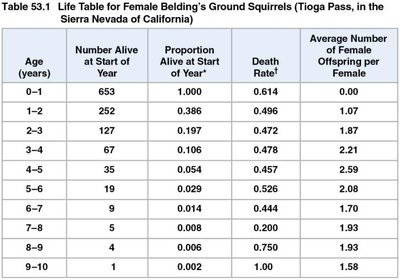
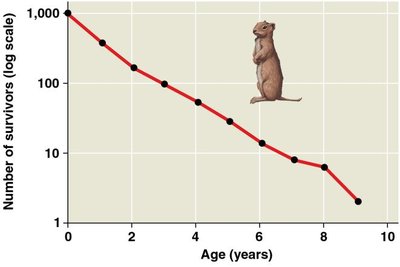
Life Table: Summarizes age-specific survival and reproductive rates within a population, often by following a cohort from birth to death.
Survivorship Curve: Graphical representation of the number of individuals surviving at each age.
Life Tables
Life tables provide age-specific data on survival and reproduction. They are essential for understanding population dynamics and predicting future changes.
Often focus on females, as they are the limiting factor in reproduction.
Require data on survivorship and fecundity (offspring produced).
Age (years) | Number Alive at Start of Year | Proportion Alive at Start of Year | Death Rate | Average Number of Female Offspring per Female |
|---|---|---|---|---|
0–1 | 653 | 1.000 | 0.614 | 0.00 |
1–2 | 252 | 0.386 | 0.496 | 1.07 |
2–3 | 127 | 0.197 | 0.472 | 1.87 |
3–4 | 67 | 0.106 | 0.478 | 2.21 |
4–5 | 35 | 0.054 | 0.457 | 2.59 |
5–6 | 19 | 0.029 | 0.474 | 2.00 |
6–7 | 9 | 0.014 | 0.444 | 1.93 |
7–8 | 5 | 0.008 | 0.200 | 1.93 |
8–9 | 4 | 0.006 | 0.250 | 1.50 |
9–10 | 1 | 0.002 | 1.000 | 1.58 |
Survivorship Curves
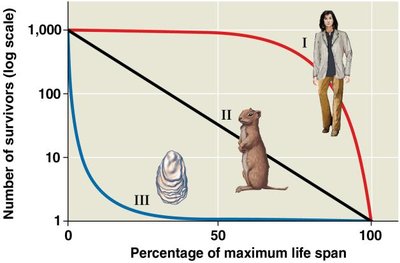
Survivorship curves plot the proportion of a cohort surviving at each age. There are three general types:
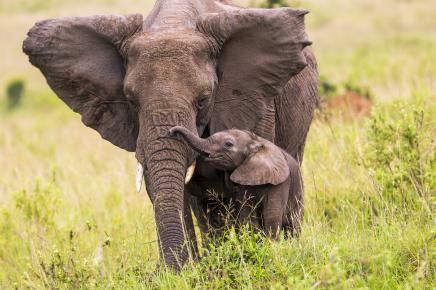
Type I: Low death rates early and middle life, high death rates in older age (e.g., humans, elephants).
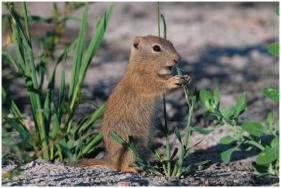
Type II: Constant death rate over the organism's life span (e.g., ground squirrels).
Type III: High death rates for young, lower for survivors (e.g., oysters, many fish).
Reproductive Rate
Reproductive rate quantifies the number of offspring produced by females in a population. It is influenced by age, frequency of reproduction, access to mates, clutch size, and parental care.
Population Growth Models
Exponential Growth Model
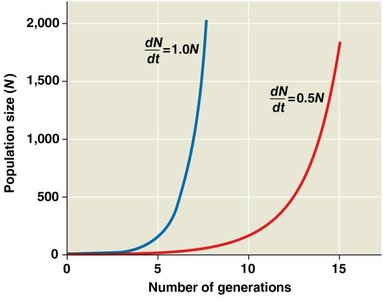
The exponential growth model describes population growth under ideal, unlimited conditions. The population increases at a constant per capita rate, resulting in a J-shaped curve.
Equation:
N: Population size
r: Per capita rate of increase
Exponential growth is observed in populations introduced to new environments or rebounding from catastrophic events.
Logistic Growth Model
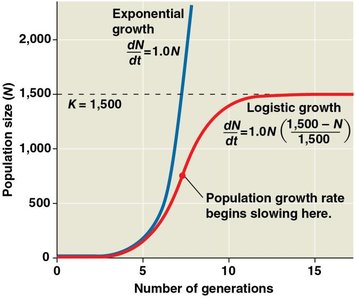
The logistic growth model incorporates environmental limits, describing how a population grows more slowly as it approaches its carrying capacity (K). The result is an S-shaped (sigmoidal) curve.
Carrying Capacity (K): Maximum population size that the environment can support.
Equation:
As N approaches K, the growth rate slows due to increased competition for resources.
Applications of Growth Models
Predicting recovery rates for endangered populations
Estimating sustainable harvest rates for wildlife management
Determining critical population sizes for conservation
Life History Traits and Population Ecology
Life History Traits
Life history traits are characteristics that affect an organism's schedule of reproduction and survival. These traits are shaped by evolutionary pressures and include:
Age at first reproduction
Frequency of reproduction (semelparity vs. iteroparity)
Number of offspring per reproductive episode
Semelparity: "One-shot" reproduction (e.g., salmon). Iteroparity: Repeated reproductive events throughout life (e.g., humans, elephants).
Population Dynamics
Factors Affecting Population Growth Rates
Direct factors: Birth rate, death rate, immigration, emigration
Indirect factors: Biotic (competition, disease, predation) and abiotic (resource availability, climate, natural disasters) influences
Predator-Prey Interactions
Predator-prey relationships can cause population cycles. For example, the snowshoe hare and lynx populations fluctuate in response to each other and resource availability. Experimental studies show that predation is a major factor in hare population cycles, more so than food supply alone.
Summary
Population ecology examines the structure and dynamics of populations, focusing on density, dispersion, and demographics.
Population growth can be modeled using exponential and logistic equations, with carrying capacity as a key limiting factor.
Life history traits and ecological interactions (such as predation) play crucial roles in shaping population dynamics.
