 Back
BackPopulation Ecology: Structure, Dynamics, and Life History Strategies
Study Guide - Smart Notes
 Tailored notes based on your materials, expanded with key definitions, examples, and context.
Population Ecology
Definition and Scope
Population ecology is the study of the factors that affect population size and how these factors change over space and time. A population is defined as a group of interbreeding individuals of the same species occupying the same habitat at the same time. Populations are considered genetic units with specific gene pools.
Example: Water lilies in a lake, wolves in Yellowstone Park.
Most species have a limited geographic range due to adaptations and environmental constraints.
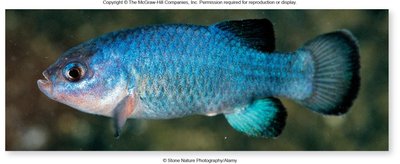
Example: The Devil’s Hole pupfish is restricted to a single spring in Nevada, while polar bears are confined to the Arctic.
Demography
Demography is the study of how births, deaths, and movement change populations over time. It involves analyzing:
Birth rates
Death rates
Age distributions
Population sizes
Demographic studies help understand population dynamics (changes through time) and structure (density, age classes, spacing).
Understanding Populations
Population Density and Measurement
Density is the number of organisms in a given unit area. It is crucial for distinguishing between rare and common species and for managing populations after disturbances.
Population growth directly affects density.
Knowledge of density aids in species management, such as setting hunting/fishing seasons and protected areas.
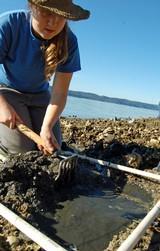
Methods to quantify population density include:
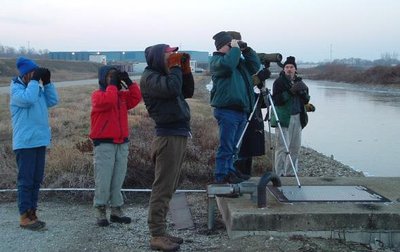
Simple visual counts
Sampling methods (e.g., quadrats, transects)
Mark-recapture method (animals are captured, marked, and released; recapture rates estimate population size)
Dispersion Patterns
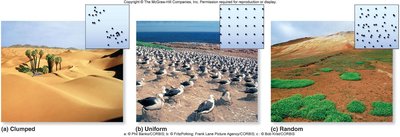
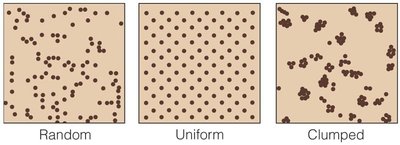
Dispersion refers to how individuals are spaced within a population. The three main patterns are:
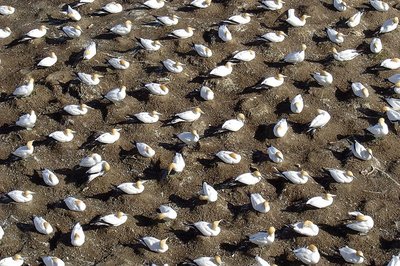
Clumped: Most common; resources are clustered, or social behavior promotes grouping.
Uniform: Often due to competition or territoriality; individuals are evenly spaced.
Random: Least common; resources are abundant and evenly distributed.
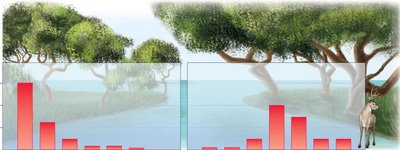
Ecological density refers to the number of individuals per unit of available living space, accounting for habitat patchiness.
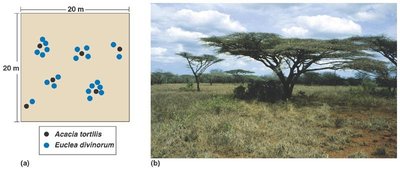
Examples of Dispersion
Clumped: Shrubs under acacia trees in savannas.
Uniform: Shrubs in arid environments due to competition for water.
Reproductive Strategies
Semelparity vs. Iteroparity
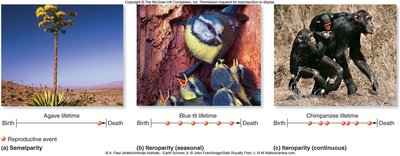
Reproductive strategies influence population structure and dynamics:
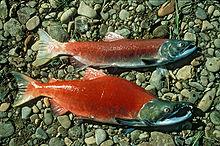
Semelparity: Organisms reproduce once in their lifetime and then die (e.g., some plants, insects, and fish).
Iteroparity: Organisms reproduce multiple times over their lifespan. This can be:
Seasonal iteroparity: Distinct breeding seasons (e.g., many birds).
Continuous iteroparity: Reproduction can occur at any time (e.g., humans, rodents).
Examples of Reproductive Strategies
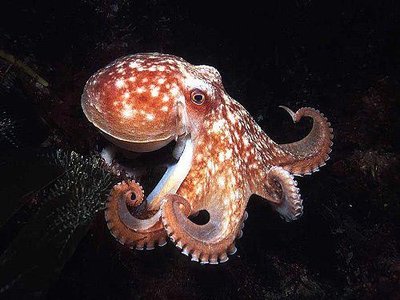
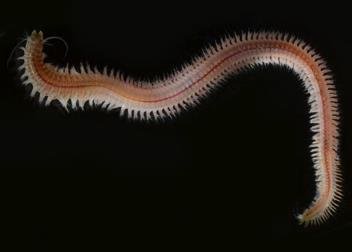
Semelparity: Sockeye salmon, octopus, and nereid worms. These species often show programmed death after reproduction.
Iteroparity: Rabbits, hares, cats, shrews, camelids, humans, rodents, dogs, cows, and sheep.
Age Classes and Cohorts
Reproductive strategy affects the age structure of populations:
Semelparous organisms produce cohorts (groups of same-aged young).
Iteroparous organisms have young of different ages.
Populations increasing in size have many young; declining populations have few young.
Demographic Tools and Life Tables
Life Tables
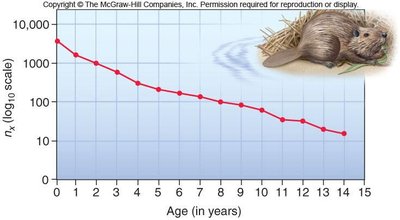
Life tables provide data on the number of individuals alive in each age class, often focusing on females. They are used to calculate survivorship and predict population growth.
Example: North American beaver life tables constructed from mandible samples.
Survivorship Curves
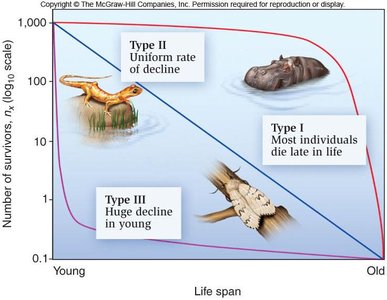
Survivorship curves graphically represent the number of individuals surviving at each age:
Type I: Most individuals die late in life (e.g., humans, large mammals).
Type II: Uniform rate of decline (e.g., some birds, reptiles).
Type III: Huge decline in young (e.g., many fish, plants, invertebrates).
Population Growth Calculations
Key demographic rates:
Age-specific fertility rate (mx): Proportion of female offspring born to females of reproductive age.
Age-specific survivorship rate (lx): Proportion of individuals alive at the start of each age class.
Net reproductive rate (R0): Overall growth rate per generation, calculated as:
If , the population is growing.
If , the population is declining.
If , the population is at equilibrium.
To predict future population size:
Population Growth Models
Exponential and Logistic Growth
Population growth can be modeled mathematically:
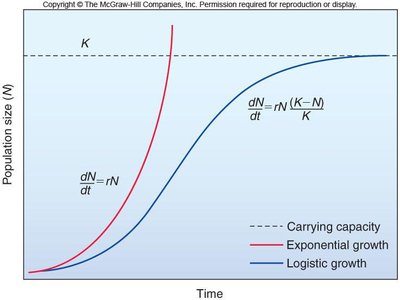
Exponential growth: Occurs when resources are unlimited. Population increases rapidly.
Logistic growth: Occurs when resources are limited. Population growth slows as it approaches carrying capacity (K).
Equations:
Exponential growth:
Logistic growth:
Life History Strategies
r-Selected vs. K-Selected Species
Species can be classified by their life history strategies:
r-selected species: High rate of per capita population growth (r), poor competitive ability, opportunistic, often small-bodied, short-lived, and produce many offspring (e.g., weeds, small mammals, birds, amphibians).
K-selected species: Stable populations near carrying capacity (K), strong competitors, lower reproductive rates, longer-lived, and produce fewer offspring (e.g., trees, elephants, sharks, rhinoceroses).
Example: Rana temporaria (r-strategist), Brookesia desperata (K-strategist).
Characteristic | r-Selected Species | K-Selected Species |
|---|---|---|
Population Growth | Rapid, variable | Slow, stable |
Body Size | Small | Large |
Reproduction | Many offspring, little care | Few offspring, much care |
Survivorship Curve | Type III | Type I |
Additional info: Life history strategies are shaped by evolutionary pressures and environmental stability. r-selected species thrive in unpredictable environments, while K-selected species dominate in stable habitats.
