 Back
BackPopulation Ecology: Structure, Dynamics, and Regulation
Study Guide - Smart Notes
 Tailored notes based on your materials, expanded with key definitions, examples, and context.
Population Ecology
Introduction to Population Ecology
Population ecology examines the factors that affect population size, density, dispersion, and demographics. It also explores how populations grow, fluctuate, and are regulated by both biotic and abiotic factors.
Population: A group of individuals of a single species living in the same general area.
Populations are described by their boundaries and size (number of individuals).
Population Density and Estimation Methods
Density is the number of individuals per unit area or volume. It is a dynamic property, changing as individuals are added (births, immigration) or removed (deaths, emigration).
Direct counting is often impractical; sampling techniques are used instead.
Mark-Recapture Method: Used to estimate population size when individuals are mobile or hard to count.
The mark-recapture formula is:
Solving for population size:
Where: s = number of individuals marked and released n = total number of individuals captured in the second sample x = number of marked individuals recaptured N = estimated population size
Patterns of Dispersion
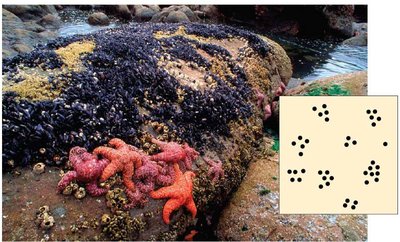
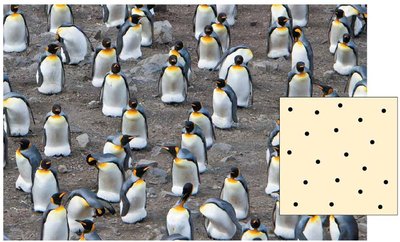
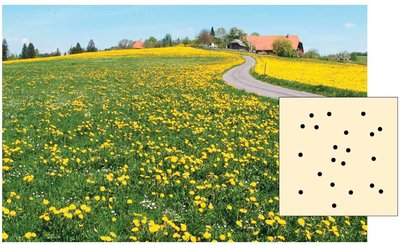
Dispersion refers to the pattern of spacing among individuals within the boundaries of the population. There are three main patterns:
Clumped: Individuals aggregate in patches, often where resources are abundant or conditions are favorable.
Uniform: Individuals are evenly spaced, often due to territoriality or competition.
Random: Unpredictable spacing, occurring in the absence of strong attractions or repulsions.
Demographics and Survivorship Curves
Demography is the study of the vital statistics of populations and how they change over time, including birth rates, death rates, and age structure.
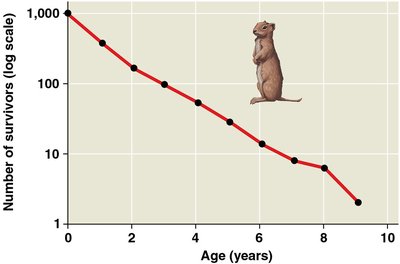
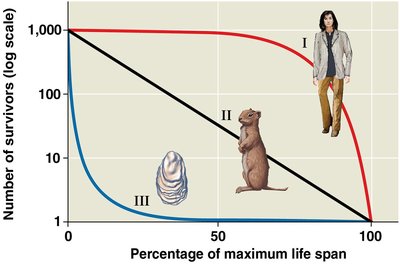
Survivorship curve: A plot of the proportion or numbers in a cohort still alive at each age.
Three general types of survivorship curves:
Type I: Low death rates early and middle life, then an increase among older age groups (e.g., humans).
Type II: Constant death rate over the organism's life span (e.g., ground squirrels).
Type III: High death rates for the young, lower for survivors (e.g., oysters).
Reproductive Rates and Life Histories
The reproductive pattern of a population is described by how reproductive output varies with the number of breeding females and their ages. Life history traits affect an organism’s schedule of reproduction and survival, including:
Age at first reproduction (maturity)
How often the organism reproduces
How many offspring are produced per reproductive episode
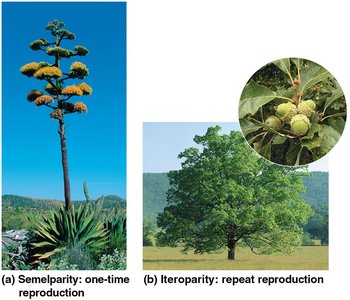
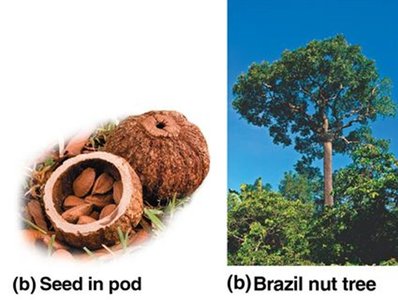
Semelparity: "One-shot" pattern of big-bang reproduction (e.g., agave plant).
Iteroparity: Repeated reproductive events throughout lifetime (e.g., oak tree).
Population Growth Models
Population growth can be modeled mathematically to understand how populations change over time.
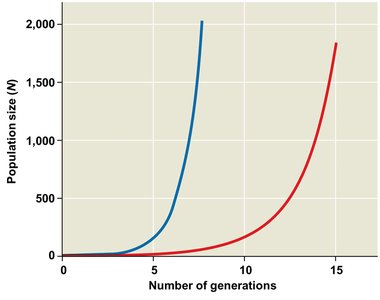
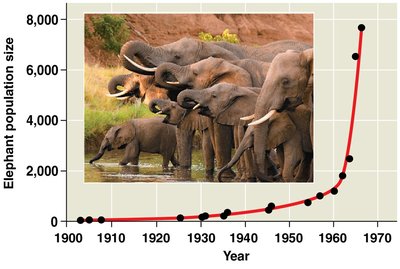
Exponential Growth Model
Describes population increase under ideal, unlimited resource conditions. The equation is:
Where: N = population size rmax = maximum per capita rate of increase
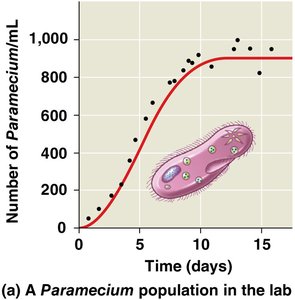
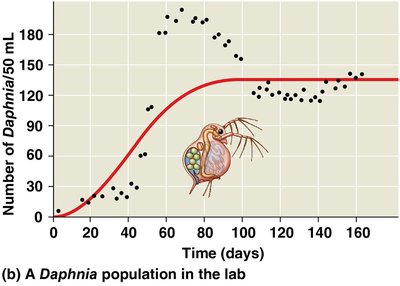
Logistic Growth Model
Describes how a population grows more slowly as it nears its carrying capacity (K):
Where K is the carrying capacity, the maximum population size the environment can sustain.
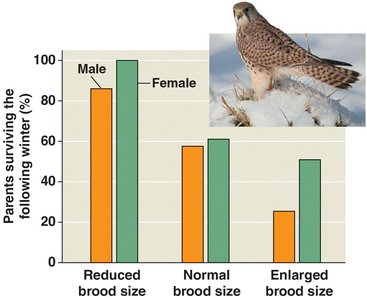
Trade-offs and Life History Strategies
Organisms face trade-offs between reproduction and survival due to limited resources. For example, producing many small offspring may increase the chance that some survive, while producing fewer, larger offspring may allow for more parental care.
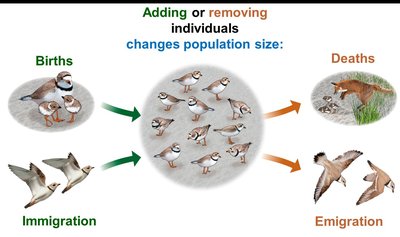
Population Change: Births, Deaths, Immigration, and Emigration
Population size changes through four main processes:
Births (add individuals)
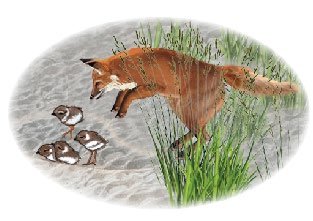
Deaths (remove individuals)
Immigration (add individuals)
Emigration (remove individuals)
Population Regulation: Density-Dependent and Density-Independent Factors
Population size can be regulated by:
Density-independent factors: Affect populations regardless of size (e.g., weather, natural disasters).
Density-dependent factors: Intensify as population increases (e.g., competition, predation, disease, territoriality, toxic wastes, intrinsic factors).
Population Dynamics and Fluctuations
Population dynamics focus on the complex interactions between biotic and abiotic factors that cause variation in population size. Some populations undergo regular cycles (e.g., snowshoe hare and lynx), while others fluctuate unpredictably.
Human Population Growth and Carrying Capacity
The human population has grown rapidly in recent centuries, but growth rates are now declining. The concept of carrying capacity applies to humans as well, with estimates of Earth's carrying capacity varying widely.
Ecological footprint: The combined land and water area required to sustain a person, city, or nation, measured in global hectares (gha).
To live sustainably, the average available is 1.7 gha per person, but the global average is 2.7 gha per person, indicating an ecological overshoot.
