 Back
Population Ecology: Structure, Dynamics, and Strategies
Study Guide - Smart Notes
 Tailored notes based on your materials, expanded with key definitions, examples, and context.
Population Ecology
Introduction to Population Ecology
Population ecology is the study of how populations of organisms interact with their environment, both biotic (living) and abiotic (non-living), and how these interactions affect population size, structure, and dynamics. Populations are groups of individuals of the same species living in the same area at the same time.
Biosphere: The global sum of all ecosystems.
Ecosystem: A community of organisms and their physical environment interacting together.
Community: All the populations of different species living and interacting in an area.
Population: A group of individuals of the same species in a given area.
Organism: An individual living entity.
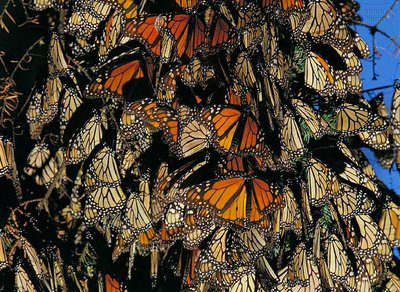
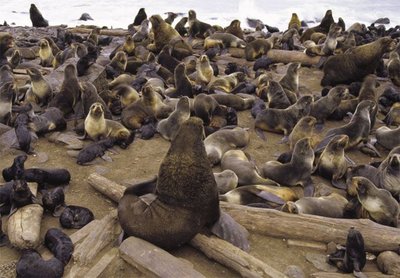
Population Interactions with the Environment
Populations interact with both biotic and abiotic components of their environment. These interactions influence their survival, reproduction, and distribution.
Biotic factors: Prey, competitors, predators, parasites, and diseases.
Abiotic factors: Sunlight, temperature, water, and soil.
Population Structure and Dynamics
Population Size and Density
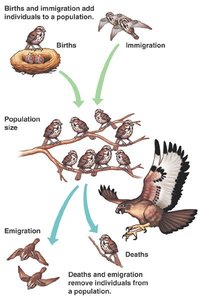
Population size refers to the number of individuals in a population, while density is the number of individuals per unit area or volume. Population size changes due to births, deaths, immigration, and emigration.
Births and Immigration: Add individuals to a population.
Deaths and Emigration: Remove individuals from a population.
Factors Affecting Population Growth Rate
Sex Ratio: The proportion of males to females in a population.
Generation Time: The average time between the birth of individuals and the birth of their offspring.
Age Structure: The distribution of individuals among different ages in a population, especially the number of females at reproductive age.
Survivorship Curves
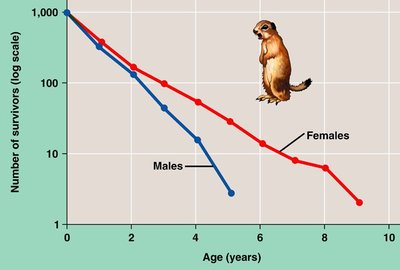
Survivorship curves graphically represent the number of individuals surviving at each age for a given species or group. There are three general types:
Type I: High survival in early and middle life, followed by a rapid decline in later life (e.g., humans).
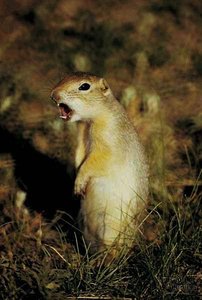
Type II: Constant mortality rate throughout life (e.g., some rodents).
Type III: High mortality early in life, with survivors living much longer (e.g., oysters).
Life History Strategies
Trade-offs: Survival vs. Reproduction
Organisms face trade-offs between investing energy in survival or reproduction. Increased reproductive effort may decrease survival due to limited resources.
Investment per offspring: Energy and resources allocated to each offspring.
Reproductive events per lifetime: Number of times an organism reproduces.
Age at first reproduction: When an organism first reproduces affects its lifetime reproductive success.
Natural selection favors life histories that maximize lifetime reproductive success.
Reproductive Strategies: r-Selected vs. K-Selected Species
Species can be classified based on their reproductive strategies:
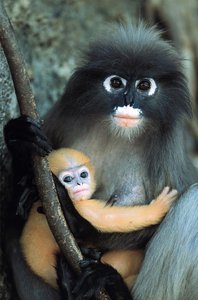
K-selected species: Late reproduction, few offspring, high parental investment (e.g., primates, coconut palms).
r-selected species: Early reproduction, many offspring, little parental care (e.g., insects, many plants).
Population Growth Models
Exponential Growth
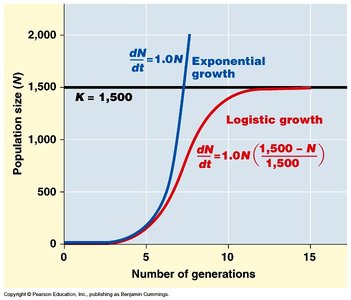
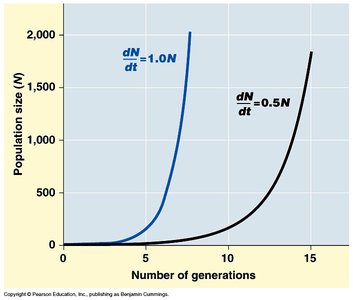
Exponential growth occurs under ideal conditions with unlimited resources. The population increases at a constant rate, described by the equation:
Exponential growth equation:
N: Number of individuals
ri: Intrinsic rate of increase
t: Time
Exponential growth is characteristic of populations introduced to new environments or rebounding from a catastrophe.
Logistic Growth and Carrying Capacity
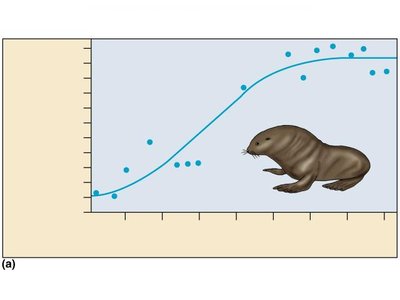
Populations cannot grow indefinitely. Logistic growth incorporates the concept of carrying capacity (K), the maximum population size an environment can support without degradation.
Logistic growth equation:
K: Carrying capacity
Limiting Factors
Population size is regulated by limiting factors, which can be density-dependent or density-independent:
Density-dependent factors: Food supply, competition, predation, disease (increase in effect as population density increases).
Density-independent factors: Abiotic factors such as sunlight, temperature, and rainfall (affect populations regardless of density).
Human Impact and Population Ecology
Introduced Species
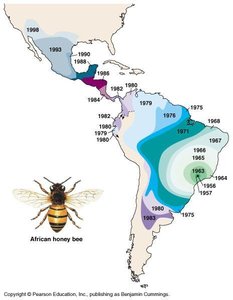
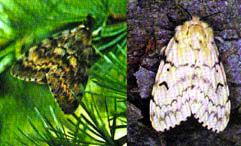
Non-native species can grow exponentially in new environments, often outcompeting native species due to the absence of natural predators, parasites, or competitors. This can reduce biodiversity and disrupt ecosystems.
Examples: African honeybee, gypsy moth, zebra mussel, purple loosestrife, buckthorn, kudzu.
Ecological Footprint
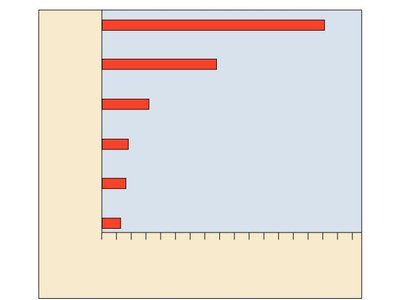
The ecological footprint measures the amount of land required to support an individual at a given standard of living. It highlights the uneven distribution of resource consumption and environmental impact among countries.
Wealthiest 20% of the world consume 86% of resources and produce 53% of CO2 emissions.
Issues of over-population versus over-consumption are central to global sustainability.
Population Measurement and Patterns
Measuring Population Density
Population density is measured as the number of individuals per unit area. Methods include direct counts and mark-recapture techniques for mobile organisms.
Mark-recapture method: A sample of individuals is captured, marked, and released. Later, another sample is captured, and the proportion of marked individuals is used to estimate total population size.
Population Dispersion Patterns
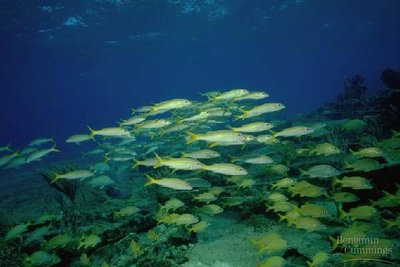
Dispersion refers to the spatial arrangement of individuals within a population. The main patterns are:
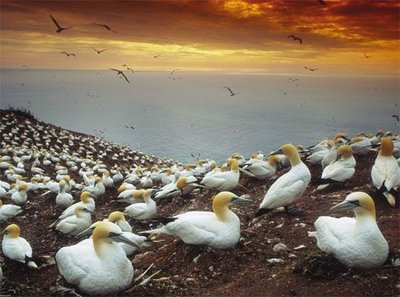
Clumped: Individuals aggregate in patches (most common, often due to resource availability or social behavior).
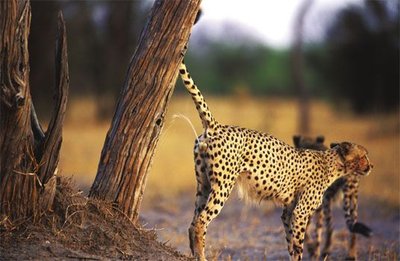
Uniform: Individuals are evenly spaced, often due to territoriality or competition.
Random: Position of each individual is independent of others, rare in nature.
Population Range and Geographic Distribution
Population range is determined by both biotic and abiotic factors, such as food availability, predators, temperature, rainfall, and habitat type. Species are adapted to specific environments, such as polar regions or rainforests.
Demography and Life Tables
Demography
Demography is the study of factors that affect population growth and decline, including vital statistics such as birth rates, death rates, and age structure. Life tables summarize the survival and reproductive rates of individuals in specific age groups.
Life tables help explain patterns such as why certain age groups (e.g., teenage males) may have higher mortality rates.
Summary Table: r-Selected vs. K-Selected Species
Characteristic | r-Selected Species | K-Selected Species |
|---|---|---|
Reproduction | Early, many offspring | Late, few offspring |
Parental Care | Little or none | High |
Survivorship Curve | Type III | Type I |
Population Growth | Rapid, often exponential | Slow, logistic near K |
Examples | Insects, many plants | Primates, coconut palms |
Additional info: This guide covers core concepts from Chapter 53 (Population Ecology) and related topics in General Biology, including population structure, growth models, life history strategies, and human impacts on populations.
