 Back
Population Ecology Study Guide – Exponential and Logistic Growth
Study Guide - Smart Notes
 Tailored notes based on your materials, expanded with key definitions, examples, and context.
Q1. Describe how a population grows during exponential growth.
Background
Topic: Exponential Growth in Population Ecology
This question tests your understanding of how populations increase when resources are unlimited.
Key Terms:
Exponential growth: Rapid population increase without resource limitation.
Unlimited resources: No constraints on food, space, or other necessities.
Step-by-Step Guidance
Recall that exponential growth occurs when each individual has access to all the resources it needs.
Understand that the population size increases rapidly, forming a J-shaped curve on a graph.
Think about how the population doubles or multiplies at a constant rate over time.
Try solving on your own before revealing the answer!
Final Answer:
During exponential growth, a population increases rapidly as if there are unlimited resources available, resulting in a J-shaped curve.
Q2. Describe the growth rate during exponential growth.
Background
Topic: Growth Rate in Exponential Growth
This question is about how the per-individual growth rate affects the overall population growth.
Key Terms:
Growth rate: The rate at which the population increases.
Per-individual growth rate: The average contribution of each individual to population growth.
Step-by-Step Guidance
Recall that in exponential growth, the per-individual growth rate remains constant.
As the population gets larger, the total number of individuals added each time period increases.
Visualize how the population grows faster as it gets bigger, due to the constant per-individual rate.
Try solving on your own before revealing the answer!
Final Answer:
The per-individual growth rate stays the same, so the population grows faster as it gets larger.
Q3. Using the graph, find the average rate of growth between hours 8 and 10.
Background
Topic: Calculating Average Growth Rate from a Population Graph
This question tests your ability to use population data from a graph to calculate the average growth rate over a specific time interval.
Key Terms and Formula:
Average growth rate: Change in population size divided by change in time.
Step-by-Step Guidance
Identify the population size at hour 8 and hour 10 from the graph.
Subtract the population at hour 8 from the population at hour 10 to find the change in population.
Subtract hour 8 from hour 10 to find the change in time.
Set up the formula for average growth rate using these values.
Try solving on your own before revealing the answer!
Final Answer:
The average rate of growth between hours 8 and 10 is 375. This is calculated as (1000 - 250) / (10 - 8) = 375.
Q4. How do you use the graph to find the average growth rate?
Background
Topic: Using Population Graphs for Calculations
This question is about interpreting population graphs to calculate growth rates.
Key Terms and Formula:
Final population: Population size at the end of the interval.
Initial population: Population size at the start of the interval.
Change in time: Time interval over which growth is measured.
Step-by-Step Guidance
Locate the initial and final population values on the graph.
Determine the corresponding time points for these values.
Subtract the initial population from the final population.
Subtract the initial time from the final time.
Set up the formula for average growth rate.
Try solving on your own before revealing the answer!
Final Answer:
To find the average growth rate, subtract the initial population from the final population, then divide by the change in time.
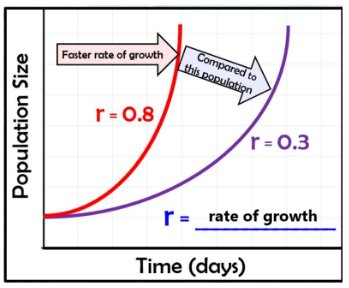
Q5. In the graph to the right, compare the growth rate of the two populations.
Background
Topic: Comparing Population Growth Rates
This question tests your ability to interpret population growth curves and compare rates visually.
Key Terms:
Growth rate (r): The rate at which a population increases.
Population curve: Graphical representation of population size over time.
Step-by-Step Guidance
Observe the steepness of each curve on the graph.
Identify which population has a higher growth rate (r value).
Compare how quickly each population increases over time.
Think about what a steeper curve means in terms of population growth.
Try solving on your own before revealing the answer!
Final Answer:
The red population (r = 0.8) has a faster rate of growth and increases more steeply compared to the purple population (r = 0.3).
Q6. In the formula below, what do each of the letters mean?
Background
Topic: Population Growth Formula
This question is about understanding the variables in the population growth equation.
Key Formula:
: Change in population size over time
: Birth rate
: Death rate
Step-by-Step Guidance
Identify what each variable represents in the context of population growth.
Understand that and are rates per unit time.
Recognize that the difference between and determines whether the population grows or shrinks.
Try solving on your own before revealing the answer!
Final Answer:
is the change in population size, is the birth rate, and is the death rate.
Q7. How do birth rate (B) and death rate (D) influence population growth (dN/dt)?
Background
Topic: Factors Affecting Population Growth
This question tests your understanding of how births and deaths affect population size.
Key Terms and Formula:
Birth rate (): Number of births per unit time.
Death rate (): Number of deaths per unit time.
Population growth (): Change in population size over time.
Step-by-Step Guidance
Recall that population growth depends on the difference between birth and death rates.
If , the population increases.
If , the population decreases.
Think about how changes in either rate affect the overall population size.
Try solving on your own before revealing the answer!
Final Answer:
If there are more births than deaths, the population grows. If there are more deaths than births, the population gets smaller.
Q8. What is the per capita growth rate (rmax) and what does it tell us?
Background
Topic: Per Capita Growth Rate in Population Ecology
This question is about the meaning and significance of the maximum per capita growth rate.
Key Terms:
Per capita growth rate (): Maximum rate at which each individual contributes to population growth.
Step-by-Step Guidance
Understand that is the highest possible growth rate per individual under ideal conditions.
Recognize that helps predict future population size.
Think about how is used in population growth equations.
Try solving on your own before revealing the answer!
Final Answer:
is the maximum per-capita growth rate of a population, and it tells us what the next population is likely to be after a certain time.
Q9. Can a population continue to grow exponentially forever? Explain your reasoning.
Background
Topic: Limits to Exponential Growth
This question tests your understanding of real-world constraints on population growth.
Key Terms:
Exponential growth: Unlimited population increase.
Resource limitation: Constraints such as food, space, and nutrients.
Step-by-Step Guidance
Recall that exponential growth assumes unlimited resources.
Think about real-world factors that limit population growth.
Consider what happens when resources become scarce.
Try solving on your own before revealing the answer!
Final Answer:
No, populations cannot grow exponentially forever because resources are limited. Eventually, factors like food and space will restrict growth.
Q10. How do you calculate population density?
Background
Topic: Population Density Calculation
This question is about determining how crowded a population is within a given area.
Key Terms and Formula:
Population density: Number of individuals per unit area.
Step-by-Step Guidance
Identify the total population size.
Determine the land area occupied by the population.
Set up the formula for population density.
Try solving on your own before revealing the answer!
Final Answer:
Population density is calculated by dividing the population by the land area.
Q11. As the population density changes, how does that impact each individual in the population?
Background
Topic: Effects of Population Density
This question tests your understanding of how increasing population density affects individuals.
Key Terms:
Population density: Number of individuals per unit area.
Resource competition: Struggle for food, water, and space.
Step-by-Step Guidance
Recall that higher density means more individuals in the same area.
Think about how competition for resources increases as density rises.
Consider the effects on individual access to food, water, and space.
Try solving on your own before revealing the answer!
Final Answer:
As population density grows, it becomes harder for each individual to get things they need, like food and water.
Q12. What is a carrying capacity?
Background
Topic: Carrying Capacity in Population Ecology
This question is about the maximum population size an environment can support.
Key Terms:
Carrying capacity (): Maximum number of individuals an environment can support.
Step-by-Step Guidance
Recall that carrying capacity is determined by available resources.
Think about how population growth slows as it approaches carrying capacity.
Consider what happens when the population exceeds carrying capacity.
Try solving on your own before revealing the answer!
Final Answer:
Carrying capacity is the maximum number of individuals an environment can support of a specific population.
Q13. Distinguish between density-dependent limiting factors and density-independent limiting factors and give THREE examples of each.
Background
Topic: Limiting Factors in Population Ecology
This question is about the types of factors that limit population growth and their effects.
Key Terms:
Density-dependent: Factors that affect large, dense populations more than smaller ones.
Density-independent: Factors that impact population size regardless of density.
Step-by-Step Guidance
Recall the definitions of density-dependent and density-independent factors.
Think of examples for each type (e.g., competition, disease for density-dependent; natural disasters, pollution for density-independent).
Consider how each factor affects population growth.
Try solving on your own before revealing the answer!
Final Answer:
Density-dependent factors: Competition, predators, disease. Density-independent factors: Natural disasters, pollution, human actions.
Q14. What happened to the elephant population as it reached carrying capacity?
Background
Topic: Population Dynamics at Carrying Capacity
This question is about the effects of reaching carrying capacity on a population.
Key Terms:
Carrying capacity: Maximum sustainable population size.
Resource competition: Increased struggle for resources.
Step-by-Step Guidance
Recall what happens when resources become limited.
Think about how competition increases as population approaches carrying capacity.
Consider the effects on survival and population size.
Try solving on your own before revealing the answer!
Final Answer:
As the elephant population reached carrying capacity, there were fewer resources, leading to more competition and not everyone surviving.
Q15. What happens to the per capita growth rate (rmax) as the population approaches the carrying capacity?
Background
Topic: Growth Rate Near Carrying Capacity
This question is about how population growth rate changes as carrying capacity is approached.
Key Terms:
Per capita growth rate (): Maximum growth rate per individual.
Carrying capacity (): Maximum sustainable population size.
Step-by-Step Guidance
Recall that as population size () approaches carrying capacity (), resources become limited.
Think about how this affects the per capita growth rate.
Consider the mathematical relationship in the logistic growth equation.
Try solving on your own before revealing the answer!
Final Answer:
The per capita growth rate gets smaller as the population approaches carrying capacity.
Q16. Describe the relationship between density-dependent limiting factors and carrying capacity.
Background
Topic: Limiting Factors and Carrying Capacity
This question is about how density-dependent factors determine carrying capacity.
Key Terms:
Density-dependent limiting factors: Factors that intensify as population density increases.
Carrying capacity (): Maximum sustainable population size.
Step-by-Step Guidance
Recall that carrying capacity is set by density-dependent factors.
Think about how these factors increase as population grows.
Consider how birth and death rates equalize at carrying capacity.
Try solving on your own before revealing the answer!
Final Answer:
Carrying capacity is determined by density-dependent limiting factors. When a population reaches carrying capacity, these factors cause the birth rate to equal the death rate.
Q17. Describe the per capita growth rate (rmax) at carrying capacity.
Background
Topic: Growth Rate at Carrying Capacity
This question is about what happens to the per capita growth rate when the population reaches carrying capacity.
Key Terms:
Per capita growth rate (): Maximum growth rate per individual.
Carrying capacity (): Maximum sustainable population size.
Step-by-Step Guidance
Recall the logistic growth equation and what happens when .
Think about how the growth rate changes as the population reaches carrying capacity.
Consider the mathematical outcome for at .
Try solving on your own before revealing the answer!
Final Answer:
The per-capita growth rate becomes 0 at carrying capacity.
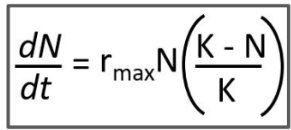
Q18. Why is the carrying capacity (K) added to the formula for logistic growth?
Background
Topic: Logistic Growth Equation
This question is about why carrying capacity is included in the logistic growth formula.
Key Formula:
Step-by-Step Guidance
Recall that logistic growth accounts for resource limitations.
Understand that represents the maximum population size the environment can support.
Think about how the formula slows population growth as approaches .
Try solving on your own before revealing the answer!
Final Answer:
Carrying capacity () is added to the logistic growth formula to account for resource limitations and to show that growth slows as the population approaches $K$.
Q19. In your own words, describe the difference between exponential and logistic growth.
Background
Topic: Exponential vs. Logistic Growth
This question is about comparing two types of population growth models.
Key Terms:
Exponential growth: Population increases rapidly without resource limits.
Logistic growth: Population growth slows and levels off as it approaches carrying capacity.
Step-by-Step Guidance
Recall that exponential growth assumes unlimited resources and forms a J-shaped curve.
Logistic growth starts exponentially but slows as resources become limited, forming an S-shaped curve.
Think about how carrying capacity affects logistic growth.
Try solving on your own before revealing the answer!
Final Answer:
Exponential growth is when populations grow as if there are unlimited resources. Logistic growth is when the growth starts off exponentially but then levels off when the population reaches its carrying capacity.
