 Back
BackLec: 9 Population Genetics and Evidence for Evolution: Study Notes
Study Guide - Smart Notes
 Tailored notes based on your materials, expanded with key definitions, examples, and context.
Evidence for Evolution
Biogeography and Macroevolution
Biogeography examines the distribution of species and supports the concept that different races can evolve into distinct species. The distinction between varieties within a species and separate species within a genus is a matter of degree, not kind. Macroevolution refers to the evolution of new species, genera, families, and higher taxonomic groups.
Homology
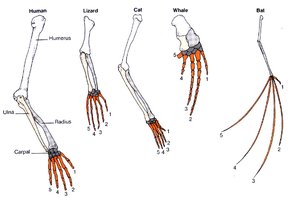
Homology is the similarity in structure of organs with different functions, indicating a common evolutionary origin. The pentadactyl limb in vertebrates is a classic example, where the same basic bone structure is found in humans, lizards, cats, whales, and bats, despite their different functions.
Humerus, Radius, Ulna, and Carpals are present in all pentadactyl limbs.
Homologous structures provide strong evidence for common ancestry.
Molecular Homology
The universality of the genetic code among all living organisms (animals, plants, bacteria) suggests descent from a common ancestor. The probability of the same genetic code evolving independently is extremely low, reinforcing the idea of shared ancestry.
Fossil Record
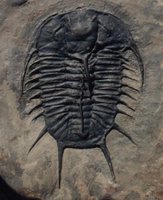
The fossil record provides chronological evidence for evolution. The order of appearance of fossils is consistent with evolutionary relationships, showing a gradual gradient of change in animals and plants over time.
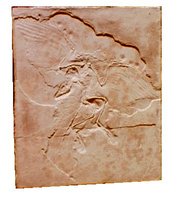
Transitional fossils, such as Archaeopteryx (with reptilian teeth and avian feathers), demonstrate evolutionary links between major groups.
Fossils of fish, amphibians, reptiles, and mammals appear in a sequence that supports evolutionary predictions.
Transitional Fossils
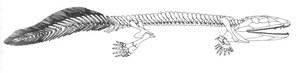
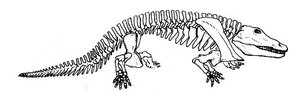
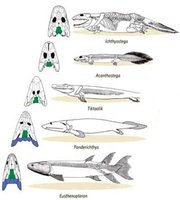
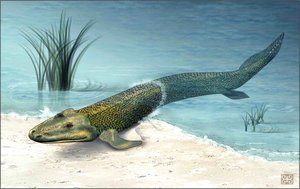
Transitional fossils illustrate evolutionary steps between major taxa. Examples include:
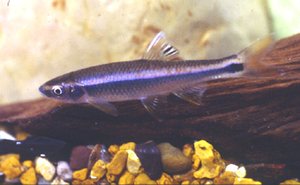
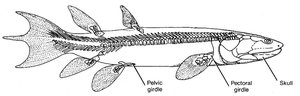
Eusthenopteron (400 million years ago): Fish with features approaching those of amphibians.
Acanthostega (360 million years ago): Early amphibian with both fish and amphibian traits.
Eryops (290 million years ago): More advanced amphibian.
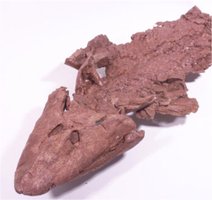
Tiktaalik roseae (375 million years ago): Amphibian-like head on a fish body, with a neck allowing head movement.
Human Evolution
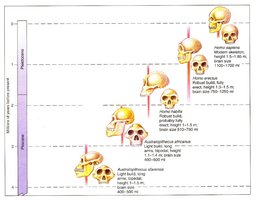
The fossil sequence of hominids shows a gradual flattening of the face and increase in brain size, supporting the evolutionary transition from early primates to modern humans.
Limitations of the Fossil Record
Not all organisms are fossilized due to environmental requirements (submersion, burial, anoxic conditions). Geological processes can destroy fossils, and hard-bodied organisms fossilize more readily than soft-bodied ones. Despite its incompleteness, the fossil record provides valuable evidence for biological change over time.
Population Genetics
Introduction to Population Genetics
Population genetics studies how the genetic makeup of populations changes over time, explaining evolution in terms of Mendelian genetics. It is the study of evolution at its smallest scale.
Mendelian Genetics and Inheritance
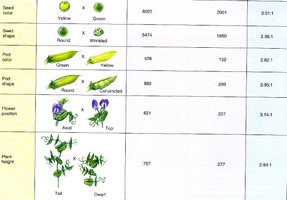
Mendel’s experiments with pea plants demonstrated that traits do not blend but are inherited as distinct units. His model of heredity includes:
Parents transmit genes to offspring.
Each parent has two copies of each gene.
Homozygous: Both gene copies are the same.
Heterozygous: Gene copies are different.
Alleles: Alternative forms of a gene (dominant or recessive).
Phenotype: Observable traits.
Genotype: Alleles possessed by an individual.
Alleles are inherited unchanged; no blending occurs.
Recessive alleles are not expressed in heterozygotes.

Definitions in Population Genetics
Population: Group of individuals of the same species in a defined area.
Gene pool: All alleles in all individuals of a population.
Fixed allele: When all individuals are homozygous for the same allele.
Calculating Allele, Genotype, and Phenotype Frequencies
Allele frequency is calculated as:
Number of copies of the allele / Total number of all alleles at that locus
Genotype frequency is:
Number of individuals with the genotype / Total number of individuals
Phenotype frequency is:
Number of individuals with the trait / Total number of individuals
Example (moth population):
Wing colour gene: B = black (dominant), b = white (recessive)
Total moths = 1,000; total alleles = 2,000
810 BB, 180 Bb, 10 bb
Frequency of b = 200 / 2000 = 0.1; Frequency of B = 1800 / 2000 = 0.9
Frequency of bb = 10 / 1000 = 0.01; Frequency of Bb = 180 / 1000 = 0.18; Frequency of BB = 810 / 1000 = 0.81
Frequency of white trait = 10 / 1000 = 0.01; Frequency of black trait = 990 / 1000 = 0.99
Hardy-Weinberg Principle
The Hardy-Weinberg equation predicts genotype frequencies from allele frequencies in a population that is not evolving:
Let p = frequency of dominant allele
Let q = frequency of recessive allele
p + q = 1
The Hardy-Weinberg equation:
p^2: Frequency of homozygous dominant genotype
2pq: Frequency of heterozygous genotype
q^2: Frequency of homozygous recessive genotype
Genetic equilibrium occurs when allele and genotype frequencies remain constant from generation to generation.
Example Problems
Given a population of 25 AA, 40 Aa, and 35 aa individuals:
Total individuals = 100
Frequency of AA = 25/100 = 0.25
Frequency of Aa = 40/100 = 0.40
Frequency of aa = 35/100 = 0.35
Total alleles = 200
Frequency of A = (25*2 + 40)/200 = 0.45
Frequency of a = (40 + 35*2)/200 = 0.55
Summary Table: Population Genetics Calculations
Type | Formula | Example Calculation |
|---|---|---|
Allele Frequency | Number of copies of allele / Total alleles | 200/2000 = 0.1 (b); 1800/2000 = 0.9 (B) |
Genotype Frequency | Number with genotype / Total individuals | 10/1000 = 0.01 (bb); 180/1000 = 0.18 (Bb); 810/1000 = 0.81 (BB) |
Phenotype Frequency | Number with trait / Total individuals | 10/1000 = 0.01 (white); 990/1000 = 0.99 (black) |
Additional info:
These notes cover core concepts from Ch. 18 (Evolution) and Ch. 19 (Population Genetics) as outlined in the course syllabus.
Further reading: Ch. 19 sections 1-3 and section 18.2 (Speciation).
