 Back
Backlec 25
Study Guide - Smart Notes
 Tailored notes based on your materials, expanded with key definitions, examples, and context.
Population Structure and Genetic Differentiation
Hardy-Weinberg Equilibrium and Inbreeding
Population genetics uses the Hardy-Weinberg Equilibrium (HWE) as a null model to describe genotype frequencies in a population. Inbreeding alters these frequencies, increasing homozygosity and reducing heterozygosity. The inbreeding coefficient (F) quantifies the probability that two alleles are identical by descent.
Genotype frequencies with inbreeding:
A11:
A12:
A22:
F-statistics: Used to measure the reduction in heterozygosity due to inbreeding or population structure.
Interpretation: F ≈ 0 indicates no genetic structure; higher values indicate more structure.
Isolation by Distance (IBD)
Concept and Evidence
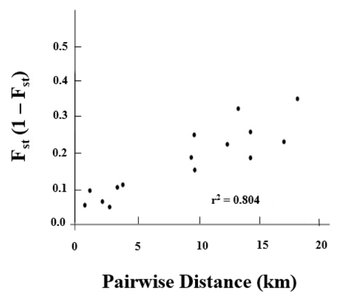
Isolation by distance (IBD) describes the pattern where genetic similarity decreases as geographic distance increases. This is expected when gene flow is more likely between nearby individuals, and genetic drift acts over space.
Key prediction: Individuals that are geographically closer are more genetically similar.
Mechanism: Genetic drift and limited dispersal drive IBD.
Isolation by Environment (IBE)
Concept and Evidence
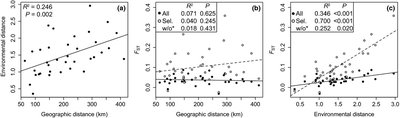
Isolation by environment (IBE) refers to genetic differentiation correlated with environmental differences rather than geographic distance. Natural selection is the main force driving IBE, as populations adapt to local environmental conditions.
Key prediction: Individuals in similar environments are more genetically similar, regardless of geographic distance.
Applications: Used to study adaptation and speciation across heterogeneous landscapes.
Population Demography and Genetic Variation
Population Size Changes
Population sizes fluctuate due to ecological factors such as predation, invasive species, and habitat changes. These demographic changes can influence allele frequencies and genetic diversity.
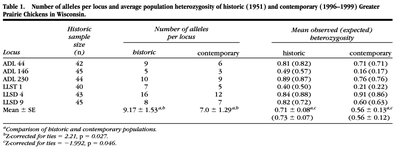
Genetic bottleneck: A sharp reduction in population size leads to loss of genetic variation and increased genetic drift.
Founder effect: When a new population is established by a small number of individuals, genetic diversity is reduced.
Detecting Genetic Bottlenecks
Genetic bottlenecks can be detected by examining changes in allele frequencies, heterozygosity, and using statistical tests such as Tajima’s D.
Tajima’s D: Compares the mean number of pairwise differences (nucleotide diversity, π) to the number of segregating sites (S). Deviations from zero can indicate selection or demographic events.
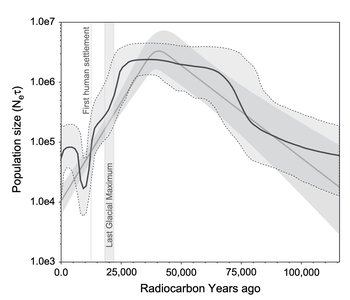
Skyline plots: Infer historical population size changes from genetic data using coalescent theory.


Climate, Geography, and Genetic Structure
Role of Climate and Geography
Historical and current climate, as well as geographic barriers, shape the genetic structure of populations. Stable climates can promote genetic structure by allowing populations to persist and diverge, while instability can reduce diversity.
Climate data sources: Georeferenced locality data, climatic layers, and niche modeling algorithms are used to estimate species distributions and environmental requirements.
Fundamental niche: The full range of environmental conditions under which a species can survive and reproduce.
Realized niche: The actual conditions occupied by the species, limited by competition and other factors.


Latitudinal Gradients in Genetic Diversity
Patterns and Hypotheses
Genetic diversity often varies with latitude, with higher diversity typically found in tropical regions. Several hypotheses explain this pattern:
Higher diversification rates in the tropics
Greater productivity and more complex biotic interactions
Older and more stable climates in tropical regions
Climatic stability hypothesis: Stable climates allow for the accumulation and maintenance of genetic diversity.
Summary Table: Effects of Demographic Events on Genetic Diversity
Event | Effect on Genetic Diversity | Detection Method |
|---|---|---|
Bottleneck | Loss of alleles, reduced heterozygosity | Tajima's D, allele frequency spectra, heterozygosity measures |
Founder Effect | Reduced diversity, unique allele combinations | Genetic markers, comparison with source population |
Population Expansion | Increase in rare alleles, excess of low-frequency variants | Negative Tajima's D, mismatch distributions |
Key Terms
Heterozygosity: The presence of different alleles at a gene locus.
Allele frequency: The proportion of a specific allele among all alleles at a locus in a population.
Genetic drift: Random changes in allele frequencies, especially significant in small populations.
Gene flow: Movement of alleles between populations, reducing genetic differences.
Segregating sites (S): Sites in a DNA sequence where at least two nucleotides are present in the sample.
Nucleotide diversity (π): Average number of nucleotide differences per site between two DNA sequences.
