 Back
Practice Exam Guidance: Quantitative and Analytical Skills in Biology
Study Guide - Smart Notes
 Tailored notes based on your materials, expanded with key definitions, examples, and context.
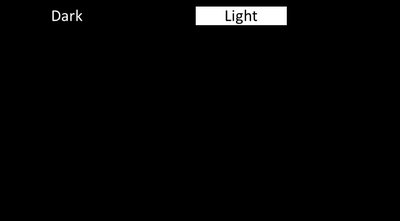
Q1a. What feature of the graph shows us that the leaf is performing photosynthesis?
Background
Topic: Photosynthesis Measurement
This question is about interpreting experimental data to determine when photosynthesis is occurring in a plant leaf, based on changes observed in a graph.
Key Terms:
Photosynthesis: The process by which plants convert light energy into chemical energy, producing oxygen and glucose from carbon dioxide and water.
Experimental Graph: A visual representation of data collected during an experiment, often showing changes over time or under different conditions.
Step-by-Step Guidance
Examine the graph for any changes that occur when the leaf is exposed to light compared to when it is in the dark.
Identify what variable is being measured on the y-axis (e.g., oxygen production, CO2 uptake, or another indicator of photosynthetic activity).
Look for a shift or increase in the measured variable when the light is turned on, as this typically signals the onset of photosynthesis.
Consider how the data pattern changes at the transition from dark to light and what this implies about the leaf's metabolic activity.
Try solving on your own before revealing the answer!
Q1b. What is the apparent effect of temperature on the rate of photosynthesis? Interpret these results – what do they appear to tell us about the biology of photosynthesis?
Background
Topic: Temperature Effects on Photosynthesis
This question asks you to analyze how different temperatures impact the rate of photosynthesis and to interpret what this means for plant biology.
Key Terms:
Photosynthetic Rate: The speed at which photosynthesis occurs, often measured by oxygen production or CO2 uptake.
Temperature: An environmental factor that can influence enzyme activity and metabolic rates in plants.
Step-by-Step Guidance
Observe how the photosynthetic rate changes as the temperature increases from 4°C to 10°C, then to 25°C, and finally to 45°C.
Note any trends, such as increases or decreases in the rate at each temperature step.
Think about the role of enzymes in photosynthesis and how temperature might affect their activity (e.g., optimal temperature range, denaturation at high temperatures).
Consider what the observed pattern suggests about the biological limits and adaptations of photosynthesis in plants.
Try solving on your own before revealing the answer!
Q2a. Is there evidence of linkage between the W and Z loci? Explain your answer.
Background
Topic: Genetic Linkage and Recombination
This question tests your understanding of how to use offspring genotype frequencies to determine whether two genes are linked (inherited together) or assort independently.
Key Terms:
Linkage: The tendency of genes located close together on a chromosome to be inherited together.
Recombination: The process by which genetic material is exchanged between homologous chromosomes, leading to new allele combinations.
Test Cross: A cross between an individual with unknown genotype and a homozygous recessive individual to reveal the unknown genotype.
Step-by-Step Guidance
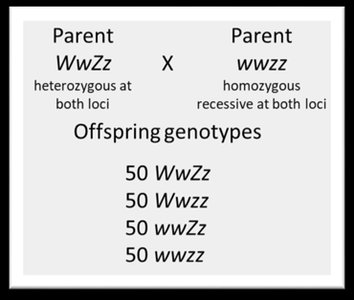
Review the offspring genotype frequencies provided in the cross (see image for details).
Compare the observed frequencies to the expected frequencies if the genes were unlinked (should be a 1:1:1:1 ratio for a dihybrid test cross).
Determine if the observed numbers deviate significantly from the expected ratio, which would suggest linkage.
Think about what a deviation from the expected ratio means in terms of crossing over between the loci.
Try solving on your own before revealing the answer!
Q2b. Is there evidence of linkage between the G and H loci? Explain your answer.
Background
Topic: Genetic Linkage Analysis
This question is similar to 2a, but with a different pair of genes and a different set of offspring genotype frequencies.
Key Terms:
Parental Types: Offspring with the same combination of alleles as the parents.
Recombinant Types: Offspring with new combinations of alleles due to crossing over.
Step-by-Step Guidance
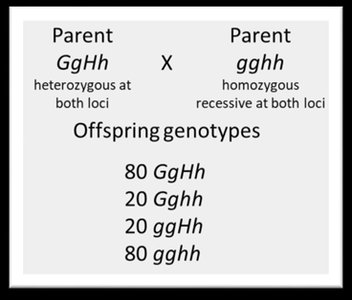
Examine the offspring genotype frequencies for the GgHh x gghh cross (see image for details).
Identify which genotypes represent parental types and which represent recombinants.
Compare the observed frequencies to the expected 1:1:1:1 ratio for unlinked genes.
Assess whether the data suggest linkage based on the distribution of parental and recombinant types.
Try solving on your own before revealing the answer!
Q2c. If you found evidence for linkage between either the W and Z loci, or the G and H loci, calculate the genetic distance between the two loci. Show how you make this calculation.
Background
Topic: Genetic Mapping and Recombination Frequency
This question asks you to calculate the genetic distance (in map units or centimorgans) between two loci based on the frequency of recombinant offspring.
Key Formula:
Step-by-Step Guidance
Identify which offspring genotypes are recombinant types (those not matching the parental combinations).
Count the number of recombinant offspring and the total number of offspring.
Calculate the recombination frequency using the formula above.
Multiply the recombination frequency by 100 to get the genetic distance in centimorgans (cM).
Try solving on your own before revealing the answer!
Q2d. Explain why experiments to determine linkage are set up this way, with one parent being heterozygous for the two loci, and the other parent being homozygous recessive.
Background
Topic: Test Cross Design in Genetics
This question is about the rationale behind using a heterozygous and a homozygous recessive parent in linkage experiments.
Key Terms:
Test Cross: Used to reveal the genotype of an individual by crossing it with a homozygous recessive individual.
Phenotypic Ratios: The observable traits in offspring that help infer genetic linkage.
Step-by-Step Guidance
Consider what information is gained by using a homozygous recessive parent (all offspring phenotypes directly reflect the gametes produced by the heterozygous parent).
Think about how this setup allows for the detection of recombinant and parental types among the offspring.
Reflect on why this method is effective for measuring recombination frequencies and mapping genes.
Try solving on your own before revealing the answer!
